Scott Ingram REALTOR® Profile picture
Jan 8, 2020 10 tweets 5 min read Read on X
December #Toronto #realestate market charts are up! Month and year-end highlights in this blog post. As always, a few bonus charts in this thread. #TorRE /1
areacode416homes.com/december-2019-…
One of the things I manually track to see if things are heating/cooling is the percent of sales that sold for over asking (SOA). Here you can see that 416 Freeholds spent the last 9 months higher than they were last year. The 9% spread in December was the highest all year. /2 Image
416 Condos spent the last 5 months hotter than 2018, and Dec was tied with Dec 2016 as highest ever for that month. Similarly, Dec gap of 10% higher than last year was largest gap of the year. /3 Image
You have to go all the way back to 1999 to find a December with less condo (apt and townhome) inventory. And there are maybe 3 times more built units in the city now. The 1297 active listings are 51% below the Dec average for the decade. #lowsupply /4 Image
I attribute the lack of condo apt units to why condo townhouses rose to 14% of all condo sales in the month. They haven't been over that since back in 2015. /5 Image
You read full year TREB sales were 87,825. Here's the 416 portion: 32,222. First time rolling 12 month volumes have been over this long-term average since March 2018. Still below the 10-year average of 34,874. /6 Image
Drilling down, Freeholds are still near 24-year lows. They're 16% below the 10-year average. The 13,289 was the highest since December 2017, and they're ⬆️15% YoY, though.
Condos at 18,714 are right at their 10-year avg of 18,743. The rolling 12 month is ⬆️2% at December. /7 Image
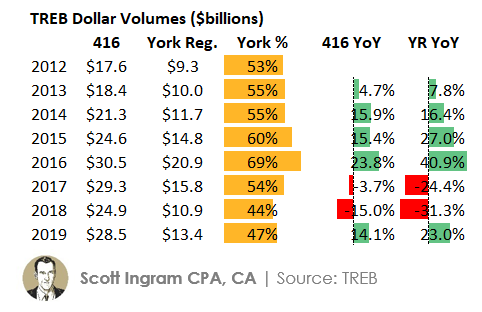
Looking at $ volumes, comparing 416 to York Region, the pattern of the last 7 years continues where #YorkRegion is up more in positive years, and down more in negative years. So, more #volatile. /8 Image
Total TREB sales by price point.
👉17 to 18 saw big cooling >$1.5M, as well as <$300K as prices moved out of bottom end tiers. Least harmed was $500-800K range /w condos and entry-level houses.
👉18 to 19 saw big gains in $700-$1750K. Return of lowrise, and entry still 🦾 /9 Image
As always, link to charts PDF is found in blog, but to go direct, here you are: /10 slideshare.net/ScottIngramCPA…

• • •

Missing some Tweet in this thread? You can try to force a refresh
 

Keep Current with Scott Ingram REALTOR®

Scott Ingram REALTOR® Profile picture

Stay in touch and get notified when new unrolls are available from this author!

Read all threads

This Thread may be Removed Anytime!

PDF

Twitter may remove this content at anytime! Save it as PDF for later use!

Try unrolling a thread yourself!

how to unroll video
  1. Follow @ThreadReaderApp to mention us!

  2. From a Twitter thread mention us with a keyword "unroll"
@threadreaderapp unroll

Practice here first or read more on our help page!

More from @areacode416

Jul 19, 2022
Here's a rental eviction story a friend of mine is letting me share, from the N12 notice (family member) to the recently concluded LTB hearing. So grab a ☕️, sit back 🪑, and read this 🧵 to see the outcome. /1
July 2020 - "I texted him at 9:30am asking about cockroaches I had seen in the apartment in the last few weeks.. he replied a few hours later asking me if the type and let me know his mom would be moving in.. all in the same message with the 🙏at the end. Next day sent N12." /2
He'd lived there 9 YEARS.

"I had a feeling it was bullshit but really what could I do with no proof.. I was tempted to stay and wait for it to get tied up in the LTB, some part of me believed it was possible he was being truthful."

I bet so many tenants feel this same way. /3
Read 16 tweets
Oct 16, 2021
Since CBC Marketplace likes investigating, I thought I'd do my own investigation on the house in the Real Estate "exposé" that aired last night, which centered around this house in Vaughan. Here's a bit more info for you in this 🧵/1
The owner was complaining about how they listed on the MLS offering to pay 1% commission to the "co-operating brokerage" (buyer's agent), which is short of the more common 2.5% commission offered in the GTA market. She claimed that agents were "steering" their clients away. /2
The CBC investigation with the large sample size of 3 agents, found 2 of them appearing to discourage their buyers (don't know if they were actually clients because they didn't mention if they'd actually signed Buyer Representation Agreements, which is no small matter). /3
Read 19 tweets
Oct 15, 2021
So CBC is running a show tonight (which I'm PRVing). Here's the article previewing it. I got emails this afternoon from TRREB and OREA about it this aft, so it might be getting some play.

I'll share the emails and my criticisms of the CBC here... /1
cbc.ca/news/canada/ma…
Here's what TRREB had to say. /2
Here's the Sept 2nd RECO bulletin referred to by TRREB above, and in the article where it said RECO "issued a notic ice about steering to the over 93,000 real estate agents, brokers and brokerages under its purview." /3
Read 14 tweets
Oct 6, 2020
TRREB has released its September #torontorealestate numbers. They like to accentuate the stats that would indicate everything is awesome, but let me point out 5⃣ STATS SHOWING MARKET COOLING ❄️ /1
First let me say it's not a COLD market yet by any means. But problem is everyone just likes to look at YoY change. When you think about it, 12 months is a somewhat arbitrary period to compare to. So September sales are way ⬆️(42%) and average prices are also ⬆️ (14%) /2
1⃣ AVERAGE YoY PRICE GROWTH IS SLOWING.

In July it was +16.9%
In August it was +20.1%
In September that slowed right down to +14.0%

Note a good chunk of the price growth is due to mix (less condo apts, more detached). /3
Read 10 tweets
Oct 5, 2020
Some weekly #torontorealestate sales numbers in this thread. Firstly, week over week pattern this year continued to follow same as last year (only couple of deviations on here, main one being Labour Day one week later this year). /1 Image
The total sales in the 416 in the past 4 weeks cumulative have been just 1% below 2019, with this week being flat. /2 Image
But "tale of two cities" continues, with freehold (lowrise houses) selling stronger than last year and condos (apts and townhouses combined) selling weaker of late (and didn't show the huge "pent-up demand" that houses did. /3 Image
Read 5 tweets
Sep 29, 2020
Bonus Tuesday #torontorealestate chart content. Here's an update weekly 416 sales year-over-year. Can see how unusually down was during COVID, then unusually up when things started re-opening. Spike week ending 9/6 was b/c normal week this year but Labour Day week last year. /1
Reverse is true for week ending 9/13 (includes Labour Day this year). That blue line was condo and freehold combined. This is separated. Can see the big YoY sales increases really driven by freeholds. /2
Here's a look at the absolute numbers underlying the freeholds. Post-June is consistently higher than last year. /3
Read 4 tweets

Did Thread Reader help you today?

Support us! We are indie developers!


This site is made by just two indie developers on a laptop doing marketing, support and development! Read more about the story.

Become a Premium Member ($3/month or $30/year) and get exclusive features!

Become Premium

Don't want to be a Premium member but still want to support us?

Make a small donation by buying us coffee ($5) or help with server cost ($10)

Donate via Paypal

Or Donate anonymously using crypto!

Ethereum

0xfe58350B80634f60Fa6Dc149a72b4DFbc17D341E copy

Bitcoin

3ATGMxNzCUFzxpMCHL5sWSt4DVtS8UqXpi copy

Thank you for your support!

Follow Us!

:(