April 7th outlook for #COVID19 fatality curves:
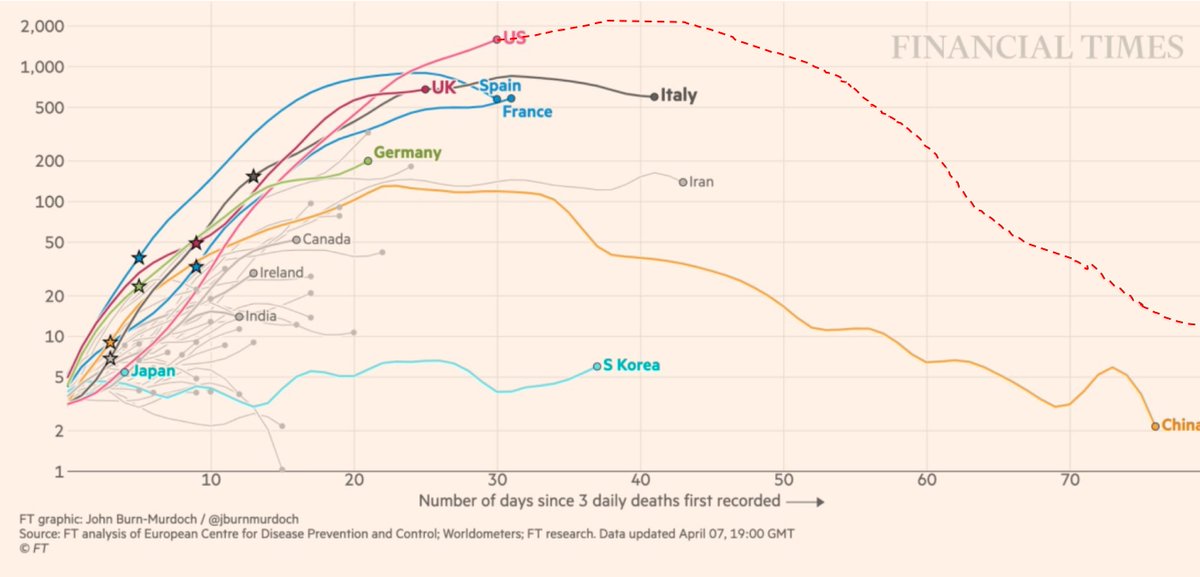
1. The US flattening is easily seen now, but tops the chart and is headed towards 2,000/day
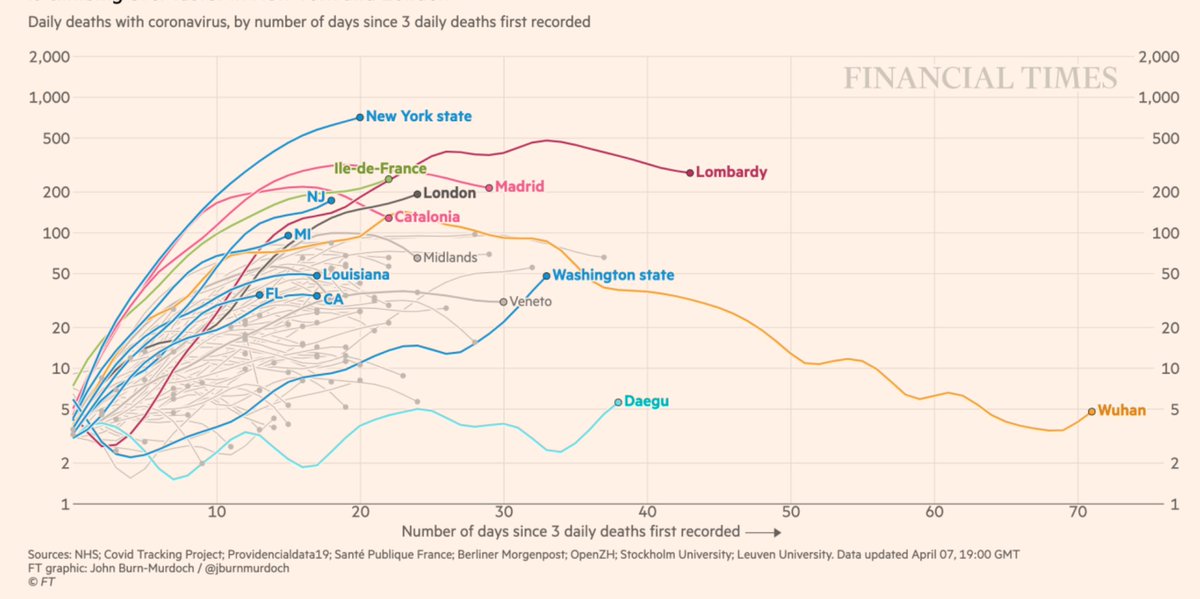
2. New York shows the same story compared with the other key regions and US states
ft.com/coronavirus-la…
1. The US flattening is easily seen now, but tops the chart and is headed towards 2,000/day
2. New York shows the same story compared with the other key regions and US states
ft.com/coronavirus-la…
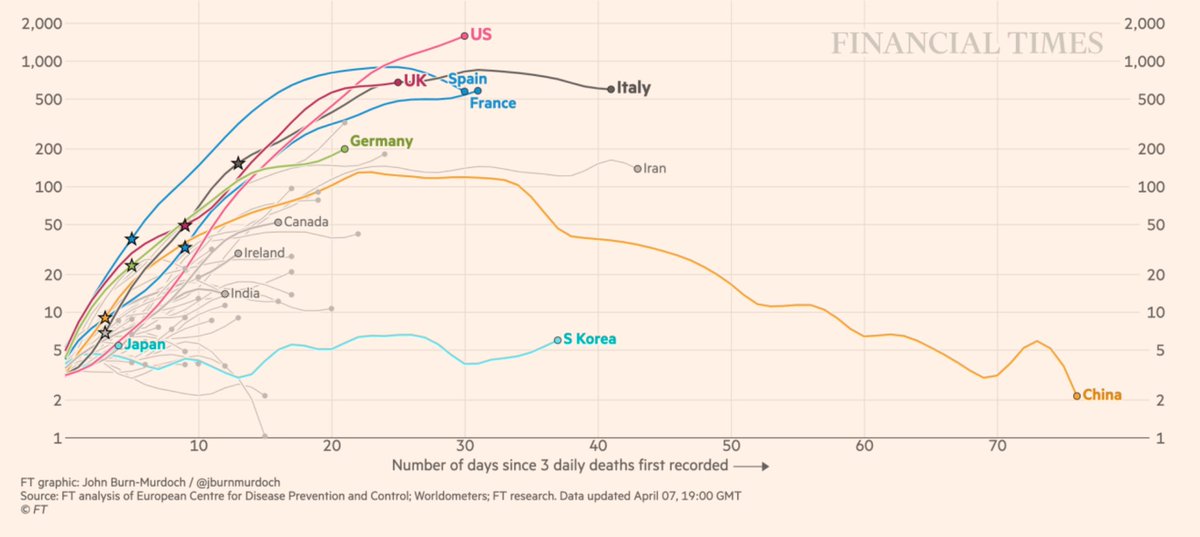
If we're "lucky" the next 40 days for the US curve (dashed line) may look like this, with a long shoulder/plateau phase (due to wide spread, millions of confirmed cases) and very gradual descent
A couple of other comments on this regional graph
—Washington state's increased slope is quite concerning and it's a trend over ~ days
—New Jersey took a turn for the worse
(whether either is related to the "weekend" data delay effect is unclear)
—Washington state's increased slope is quite concerning and it's a trend over ~ days
—New Jersey took a turn for the worse
(whether either is related to the "weekend" data delay effect is unclear)