
😷Social Distancing in the UK Update😷 Now with ANIMATIONS🎥Last week (see below) I looked at Google Community Reports on changes in workplace (& other) activity across British regions. I now have an extra week of data & income measures at the regional level. What do we see? 1/n
First off, the Brexit relationship was still there on April 9th (see below) - workplace activity has declined more in 'Remain' areas. The big question is why and I very deliberately was careful about that. Maybe it's because these areas are richer and people work from home? 2/n 

We can have a look at that pattern in the figure below, which plots GDP per capita (i.e. personal income) at the local level versus changes in workplace activity from the norm for April 9th. Definitely some (negative) relationship but looks weaker than the 'political' one. 3/n

How about the density of population. Is it easier for people in cities to work from home? Or to move around less? We can plot the change in workplace activity against population density - which I log because it's very skewed otherwise. No obvious relationship here. 4/n

But this is just one day: the Thursday before Easter. Maybe that's a weird day? What do these patterns look like over the last six weeks you ask? Here's where the animations come in 🤓. I can do the same scatter (without place names, I'm not evil) for each day since Feb 29th. 5/n
Here is the plot for workplace activity versus Remain vote. What I am doing here is showing each region, with a bubble to show population size and with a line of best fit. Two things: 1. EVERYWHERE SOCIAL DISTANCES 👊🍾 2. There's a clear negative slope after mid-March. 6/n
Notice also the bounces at the weekend - 'workplace activity' is more like the pre-COVID world then. Big picture is that the UK has done a good job social distancing and cross regional differences are dwarfed by over time difference. 7/n
Now we can do the same for the relationship between income per head in each region and workplace activity. We see a fairly similar story but it's a less tight fit than with the Remain vote. We shall see why shortly. 8/n
Here in turn is the relationship between (log) population density and workplace activity since Feb 29th. As with income the slope is negative but less tight-fitting. So what is driving behaviour more? 9/n
We need to be careful here - correlation is not causation etc etc, and the big causal effect is obviously the government announcing a lockdown. But what we can do is run linear regressions predicting workplace activity and look at the relative impact of each variable 10/n
So let's do that for April 9th. We predict workplace activity with Remain vote, income per head, income growth, (log) population density, % over 70, % under 30, and an indicator for each British region. 11/n
We can then 'extract' the effect of each indicator alone and plot it against the variation in workplace activity not explained by the other variables. This is called a 'partial regression plot' (we plot residuals vs residuals). Here's Remain vs workplace activity on April 9 12/n

That's a pretty strong negative relationship. What about income per head? Much much weaker. Loosely we can say that the political factor is more helpful in explaining aggregate behaviour than the economic one. 13/n

And what about density? Again there's a negative relationship but it's not particularly tight, once we control for other things. 14/n

We can look at lots of these regressions - one for each day since Feb 29. We are going to plot the 'coefficient' ( slope of the line of best fit) and its confidence intervals ( measures of uncertainty) for each day. Here's a plot for Remain & workplace @robwhickman's code 15/n
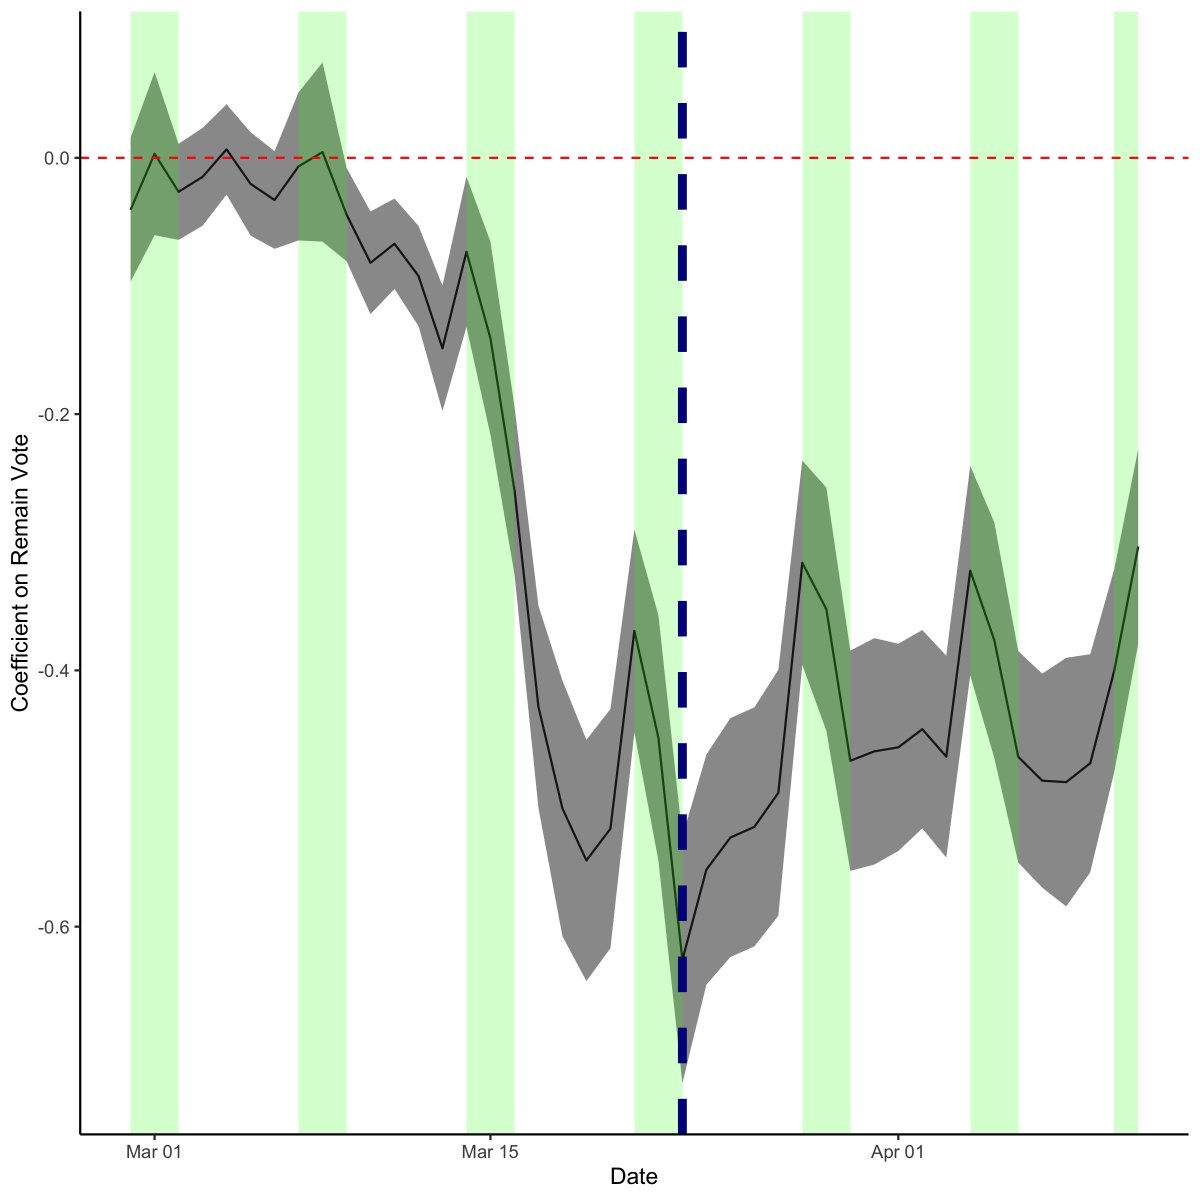
See how the coefficient plummets after mid-March. What this means is that the Remain vote has become a stronger (negative) predictor of workplace activity. It bumps around after that following the week/weekend. 16/n
Now workplace activity is only one measure Google collects (though the data is most comprehensive here). It also looks at groceries, parks, residential, retail and recreation, and transit. So here is the over-time relationship between Remain and each of those activities 17/n

Notice how Remain predicts workplace and transit very well (negative relationship). Retail and recreation pretty well (also negative) and residential pretty well (positive - people more likely to stay at home). It's rubbish for groceries and parks 18/n
What about regional income per head? That turns out to be a good negative predictor of grocery, park, retail, and transit activity. OK for workplace and useless for residential 19/n

Finally, population density - a mixed bag - a positive predictor of going to the grocery and staying at home (& maybe parks); a negative predictor of transit and workplace, and no predictor of retail. 20/n

OK that's enough graphs 😓. What are the take homes?
1. EVERYWHERE HAS SOCIAL DISTANCED!
2. DIFFERENCES STILL REMAIN ACROSS REGIONS
3. THOSE DIFFERENCES ARE ASSOCIATED WITH POLITICAL, ECONOMIC, AND DEMOGRAPHIC DIFFERENCES
4. POLITICAL OFTEN STRONGEST
21/n
1. EVERYWHERE HAS SOCIAL DISTANCED!
2. DIFFERENCES STILL REMAIN ACROSS REGIONS
3. THOSE DIFFERENCES ARE ASSOCIATED WITH POLITICAL, ECONOMIC, AND DEMOGRAPHIC DIFFERENCES
4. POLITICAL OFTEN STRONGEST
21/n
Why does this matter? If different places in the UK are having very different experiences of the lockdown this *could* widen existing cleavages. If in some places people still have to go to work and risk illness while others can work from home that could create resentment. 22/n
Similarly different areas may be chafing at the bit more fiercely to end the lockdown. We don't have the 'liberation movements' that Donald Trump seems to love so much right now. But we're only a month in... 23/n
Finally, while we should not rush to any conclusions about differences across the UK - and certainly not to inane moral judgments about people - I think it IS worth knowing what the data shows and thinking about what might be going on. 24/n
I'll put the new data and new code to make these figures up at my Github - github.com/benwansell/COV…. Thanks again to @robwhickman for his coding contributions and please do have a look if you're interested.

