My Authors
Read all threads
Analysis: #NYSE $BRK.B

Case 253 #Berkshire_Hathaway Inc.

DISCLAIMER: The analysis is strictly for educational purposes and should not be construed as an invitation to trade.

#BRK.B 1/4
Chart 1
Weekly Chart: Following the strong break/close below the 2018 trading range, in March, price quickly traded through the vacuum finding buyers positioned at the formidable 2017 #pivot - just below the #Fib. 382 (168.10). Price has since then .....

BRK.B 2/4
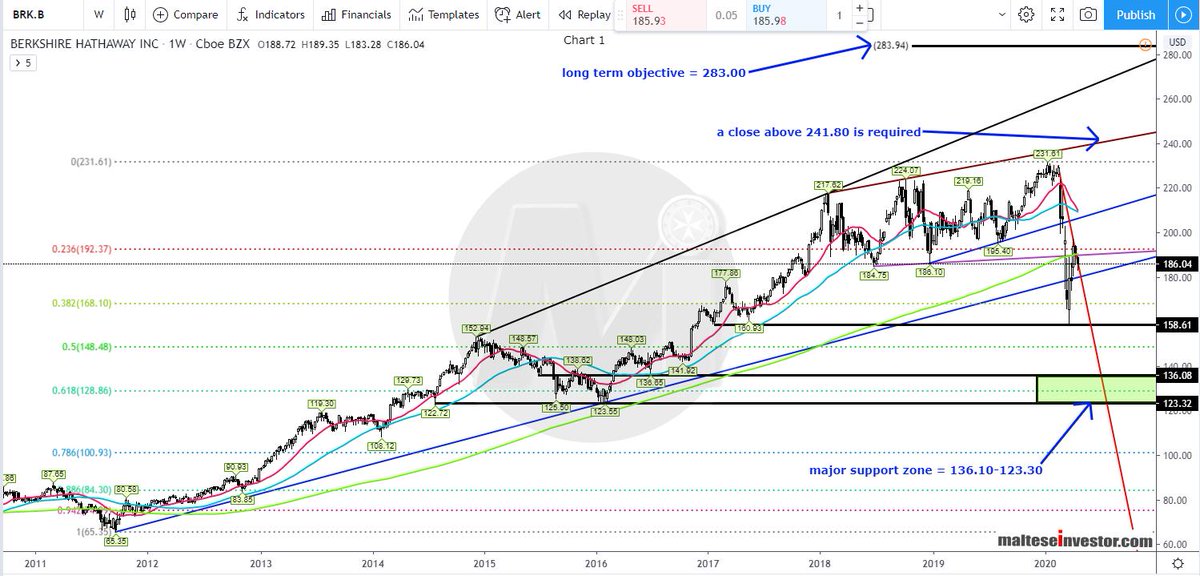
..... rebounded but is unable to close above the 2018 #trendline and #SMA 200 at 190.10/47 respectively. A close below 178.00 will re-target the 2017 lows, possibly setting sights on the Fib. 0.50 at 148.48 with major #support further down.

BRK.B 3/4
Chart 2
Daily Chart: The #Strategy is printed on the image.

$BRK.B 4/4
Missing some Tweet in this thread? You can try to force a refresh.

Enjoying this thread?

Keep Current with malteseinvestor

Profile picture

Stay in touch and get notified when new unrolls are available from this author!

Read all threads

This Thread may be Removed Anytime!

Twitter may remove this content at anytime, convert it as a PDF, save and print for later use!

Try unrolling a thread yourself!

how to unroll video

1) Follow Thread Reader App on Twitter so you can easily mention us!

2) Go to a Twitter thread (series of Tweets by the same owner) and mention us with a keyword "unroll" @threadreaderapp unroll

You can practice here first or read more on our help page!

Follow Us on Twitter!

Did Thread Reader help you today?

Support us! We are indie developers!


This site is made by just two indie developers on a laptop doing marketing, support and development! Read more about the story.

Become a Premium Member ($3.00/month or $30.00/year) and get exclusive features!

Become Premium

Too expensive? Make a small donation by buying us coffee ($5) or help with server cost ($10)

Donate via Paypal Become our Patreon

Thank you for your support!