Use of care and mortality due to corona in Finland, Sweden, Norway, Denmark, Iceland and Estonia; data from yesterday 30.4.
Read the whole thread. (English)
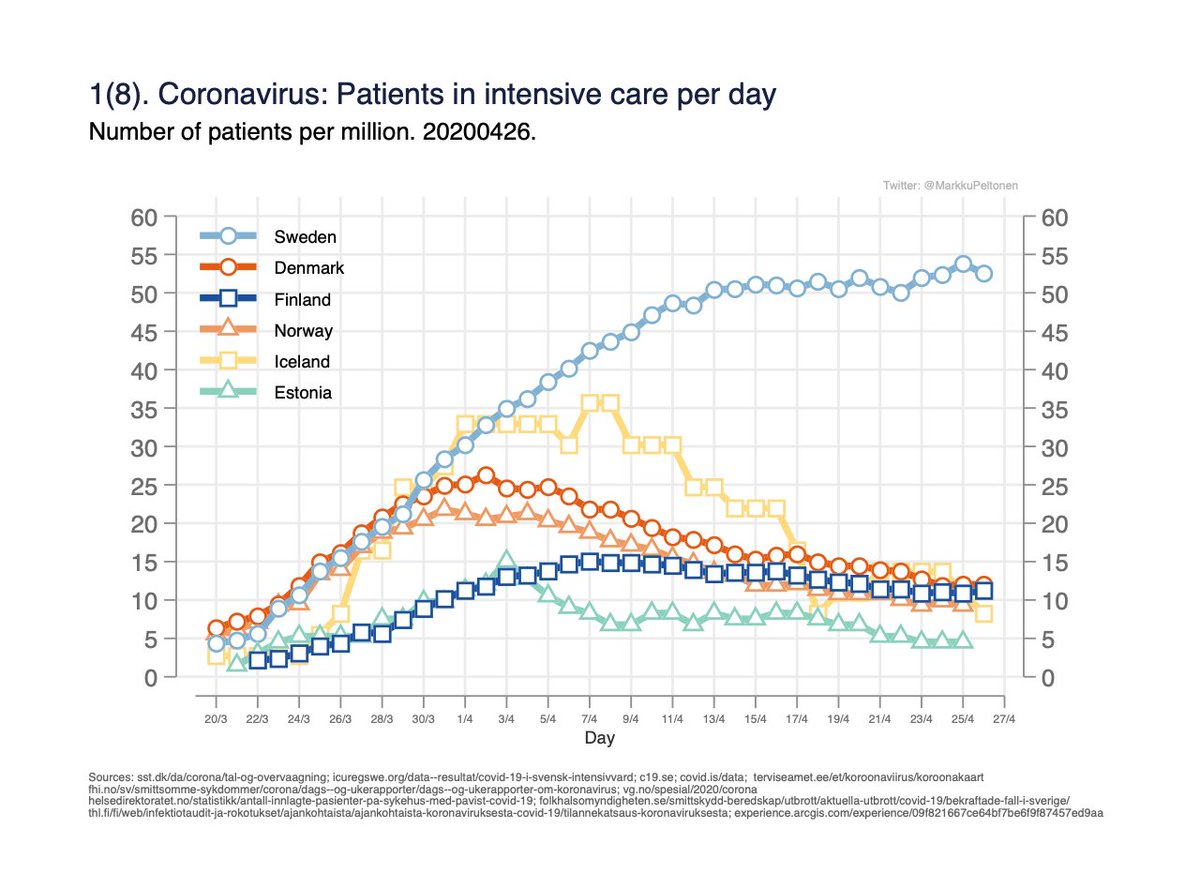
Fig 1. Number of persons in intensive care per day. Measures the burden on intensive care capacity. 1/x
Read the whole thread. (English)
Fig 1. Number of persons in intensive care per day. Measures the burden on intensive care capacity. 1/x

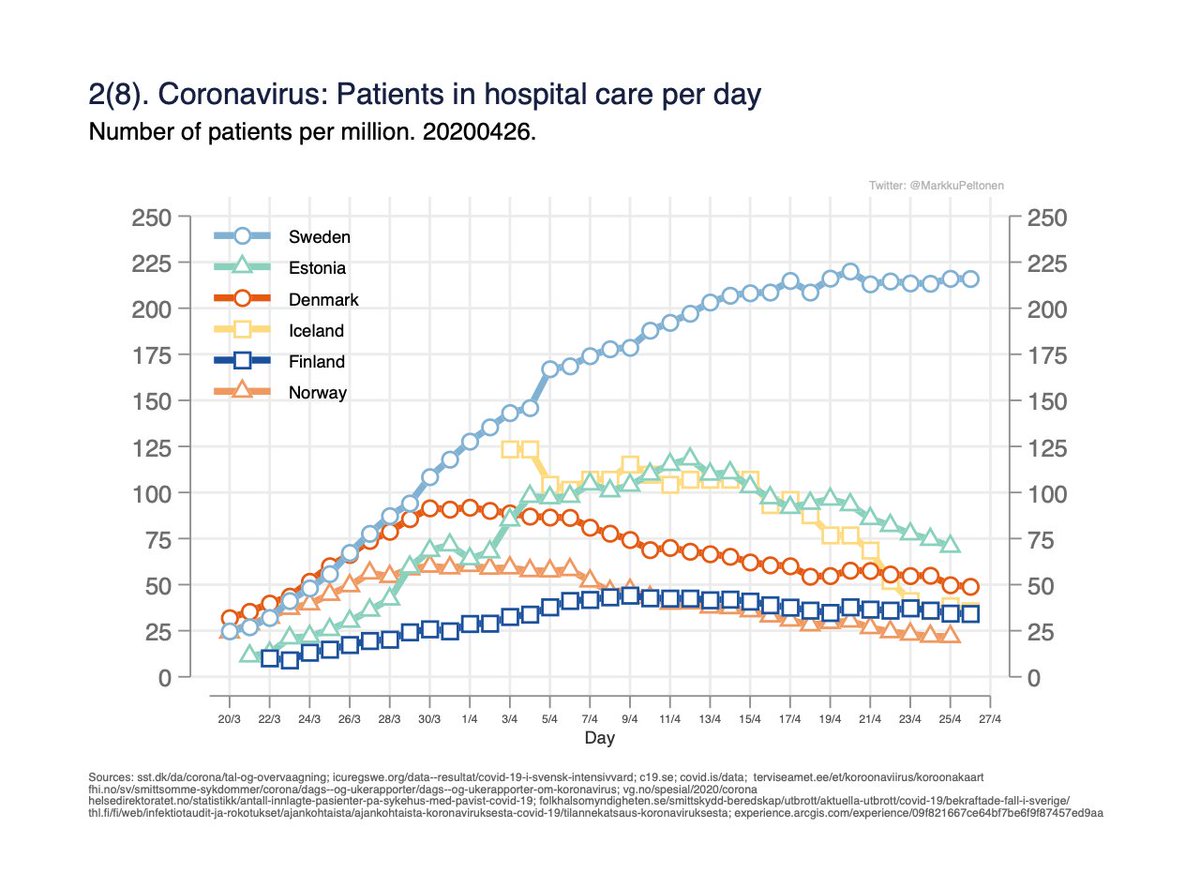
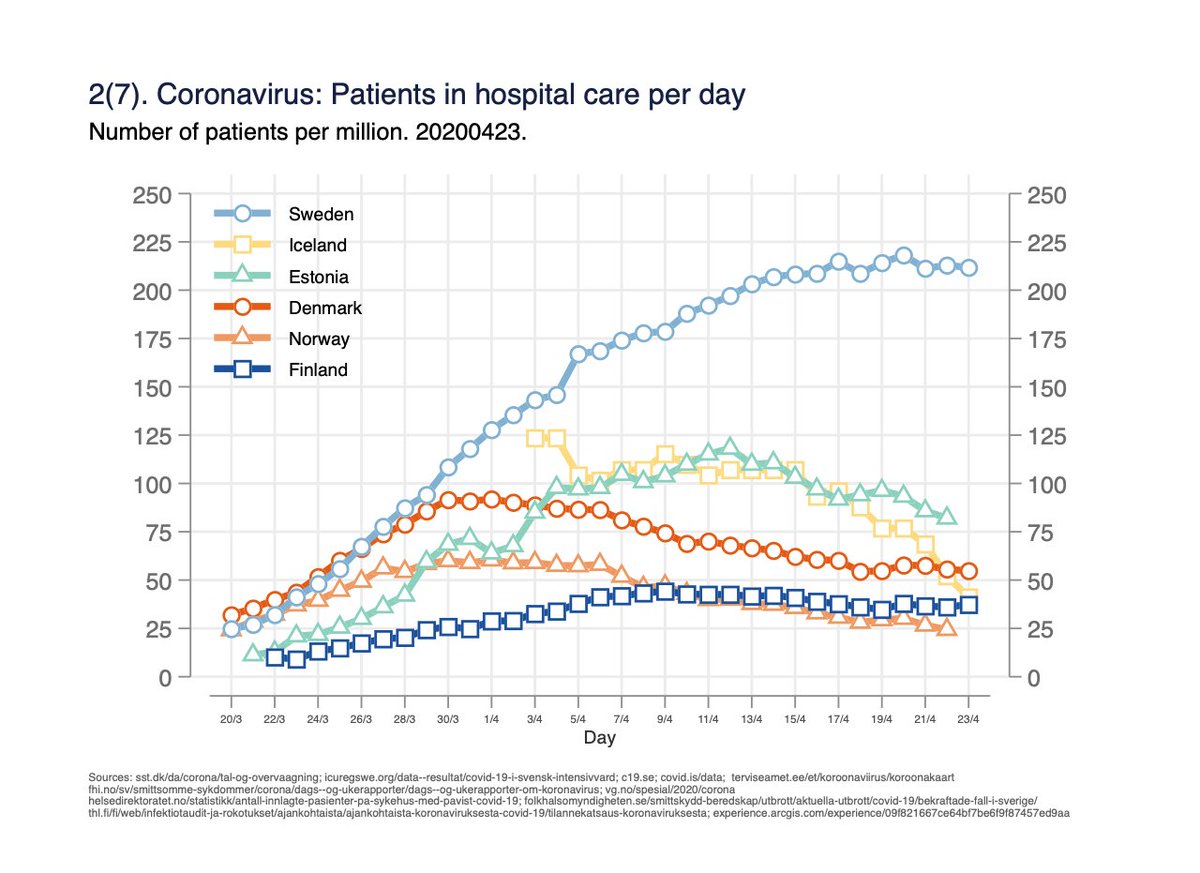
Fig 2. Number of persons in hospital care per day. Measures the burden on hospital capacity. 2/x

Fig 3. Mortality per million population. 3/x

Fig 4. Mortality per million population on log-scale, by days since 2/million deaths in the country. 4/x

Fig 5. Absolute number of deaths by days since 10th death in the country. 5/x

Geographical differences within Finland; might be of interest to other countries to understand the spread&trend between the capital area (Helsinki) vs rest.
Fig 6. Nr of persons in intensive care/day by the five “specialised medical care regions”: 6/x
Fig 6. Nr of persons in intensive care/day by the five “specialised medical care regions”: 6/x

Fig 7. Within Finland: Number of persons in hospital care per day by the five “specialised medical care regions”: 7/x

Fig 8(8). Within Finland: Mortality per million in capital area (Helsinki) vs rest of Finland combined. 8/x

Hospital care either stable or continued decline; no clear increases anywhere.
In Finland, the geographical differences still large (Helsinki vs rest) but all regions mainly declining. 9/x
In Finland, the geographical differences still large (Helsinki vs rest) but all regions mainly declining. 9/x
Yesterday Apples mobility data; are Apple-users representative for the population? Age/sex, socioeconomics, etc, might differ from the general population, and also be linked to mobility. With Googles data possible to evaluate. 10/x
google.com/covid19/mobili…
google.com/covid19/mobili…
Extra: Google mobility data 1; changes in percent from baseline (see footnote for explanation) in Retain/recreation; Grocery/Pharmacies; Parks. 11/x


Extra: Google mobility data 2; changes in percent from baseline (see footnote for explanation) in Workplaces; Residential; Transit. 12/x


Confirms decline in retail/recreation; workplaces, transit and also groceries (not as clear); more time at home; parks.
One can spot the different periods for winter-holidays in different areas from workplaces (weeks 8 and 9 differ); importance of this for spread? 13/x
One can spot the different periods for winter-holidays in different areas from workplaces (weeks 8 and 9 differ); importance of this for spread? 13/x
Sweden is surprisingly similar to the other countries in these measures.
‘ @virkola presented the Google-data from this time-perspective in more detail earlier: 15/x
‘ @virkola presented the Google-data from this time-perspective in more detail earlier: 15/x
Next update on Monday 4.5!
16/16
16/16
Ps. While comparisons about the *levels between countries* with this kind of data is difficult, I do think these give a rough idea about the *within country changes*, and differences in *when* changes happen in different countries.