Unemployment in Canada rose to 13% in April, but that masks much of the story. Many have zero hours. Many others exited the labour force.
I've put together some alternative measures of the 'effective' unemployment rate in #cdnecon. Now: 32%. (Will explain in this thread.)
I've put together some alternative measures of the 'effective' unemployment rate in #cdnecon. Now: 32%. (Will explain in this thread.)
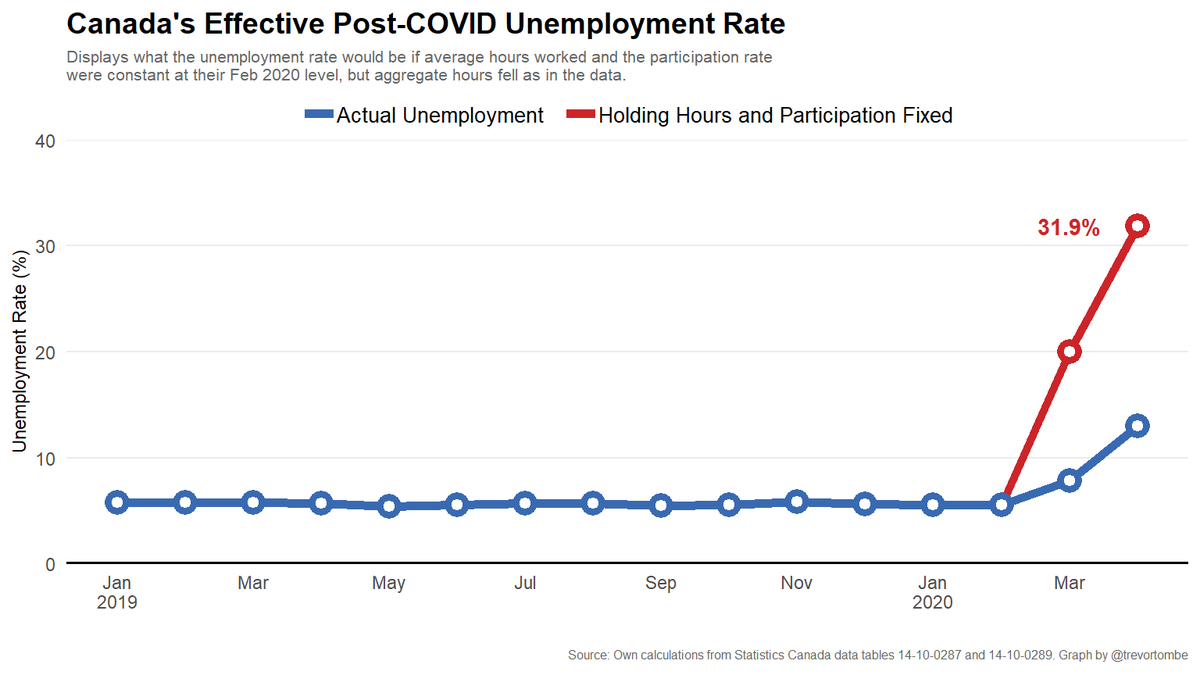
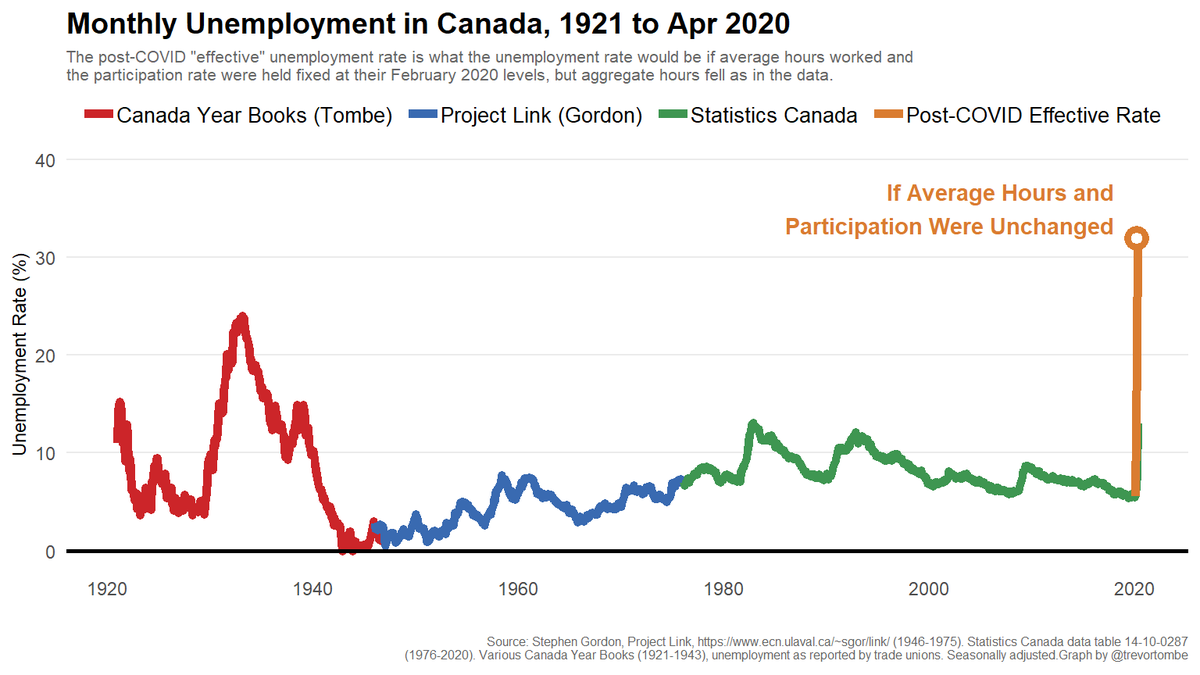
This says that unemployment "would have been" 32% if the participation rate and average hours were unchanged between February and April 2020. Usually this doesn't change much from month-to-month. See red line pre-Feb.

And here's the decomposition of the changes. Much of the increase is because of people leaving the labour force (who aren't counted as "unemployed").

And most of the changes in average hours are because of people who are "employed" but aren't working any hours. Roughly 3 million more people since Feb.
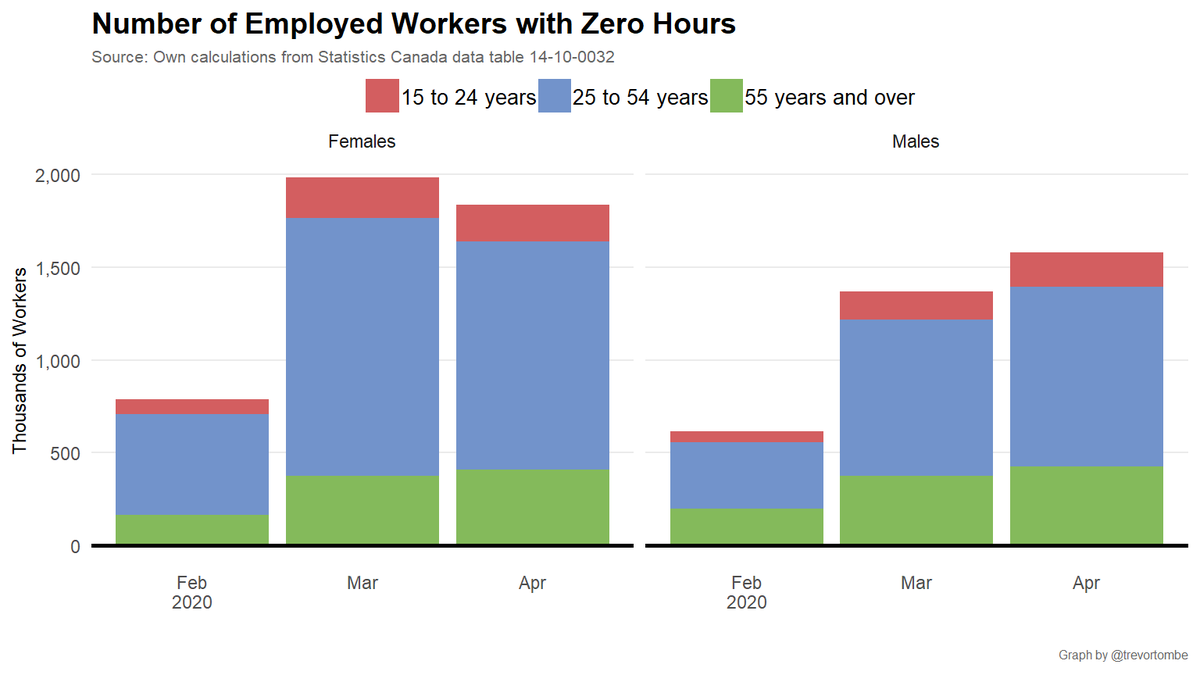
As a quick aside, conditional on having any hours at all, the average hours worked has declined somewhat, but not much. So changes in average hours driven mainly by the extensive margin of workers moving to zero hours.

Wonk aside: to calculate this counterfactual unemployment rate "holding hours and participation fixed" I wrote a brief explainer so you know the equation I'm using. Apologies for typos. Basically just uses the change in aggregate total hours to infer a new unemployment rate.

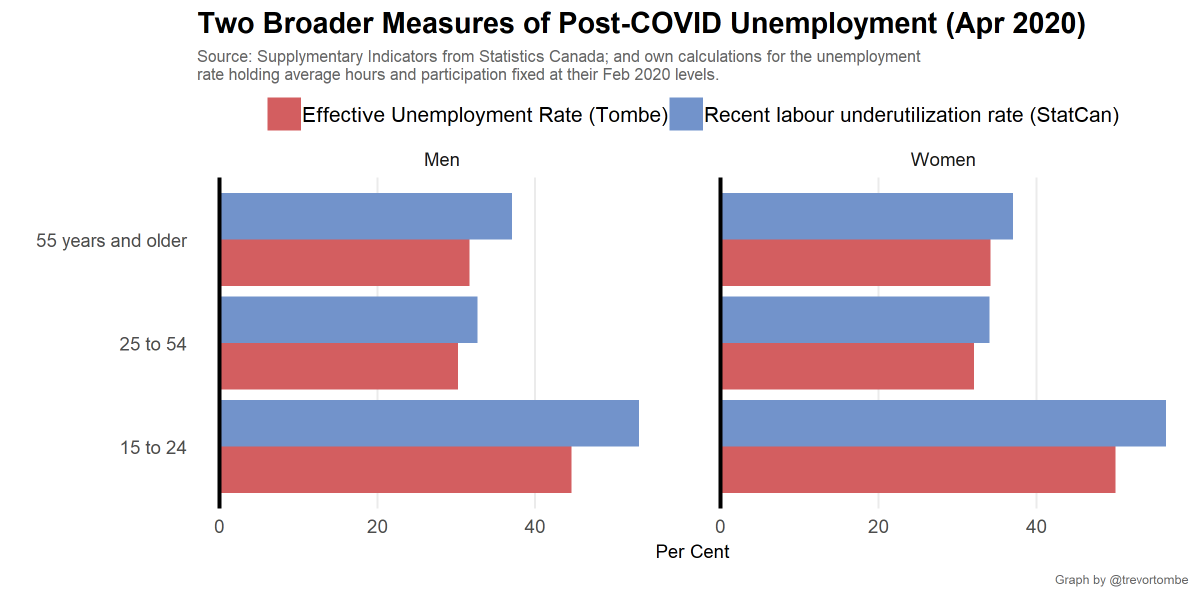
By age and sex, there is large variation. Effective unemployment rate for young women is now over 50%. For young men, nearly 45%. Prime-age workers, roughly one-third.

And across provinces, driven by the large drop in hours in Quebec, that province has a 40% effective unemployment rate in April. NL still highest, due to high pre-COVID unemployment rate. But it's close. MB has lowest.

And historically, a one-third effective unemployment rate is far beyond the worst unemployment rate ever recorded. Here's a long historical comparison for #cdnecon
To be clear, the "effective unemployment rate" that I calculate above is different than the "recent labour underutilization rate" reported by StatsCan. But the two are close. They don't (from what I can tell) report enough data to separately calculate their underutilization rate.

Thanks to some fine folks at @StatCan_eng (who emailed supplementary indicators), here's a comparison between their underutilization rate and the "effective unemployment" I calculate above. Very close, but my measure is consistently lower.