Further to my initiative of #LetsLearn where my objective is to de-code complex things & make things simple and available for analysis...
Today, I will try to make a complex looking chart into a clean & simple one (only useful for people who are PATTERN based trader/analyst)..1/n
Today, I will try to make a complex looking chart into a clean & simple one (only useful for people who are PATTERN based trader/analyst)..1/n
amazon.in/Pring-Price-Pa…
Further as disclaimer, the presented way will be more useful for people who have followed Martin Pring's book on chart patterns.. (images taken from Kindle version of the book)
Further as disclaimer, the presented way will be more useful for people who have followed Martin Pring's book on chart patterns.. (images taken from Kindle version of the book)
The below are Candlestick charts of #NIFTY50.. a lot of times market moves inside a range throwing multiple Bullish/Bearish candlestick patterns and adds up the clutter in analysis (Pro Candlestick / Bar / short term traders wont have a problem) but for others it is a confusion..
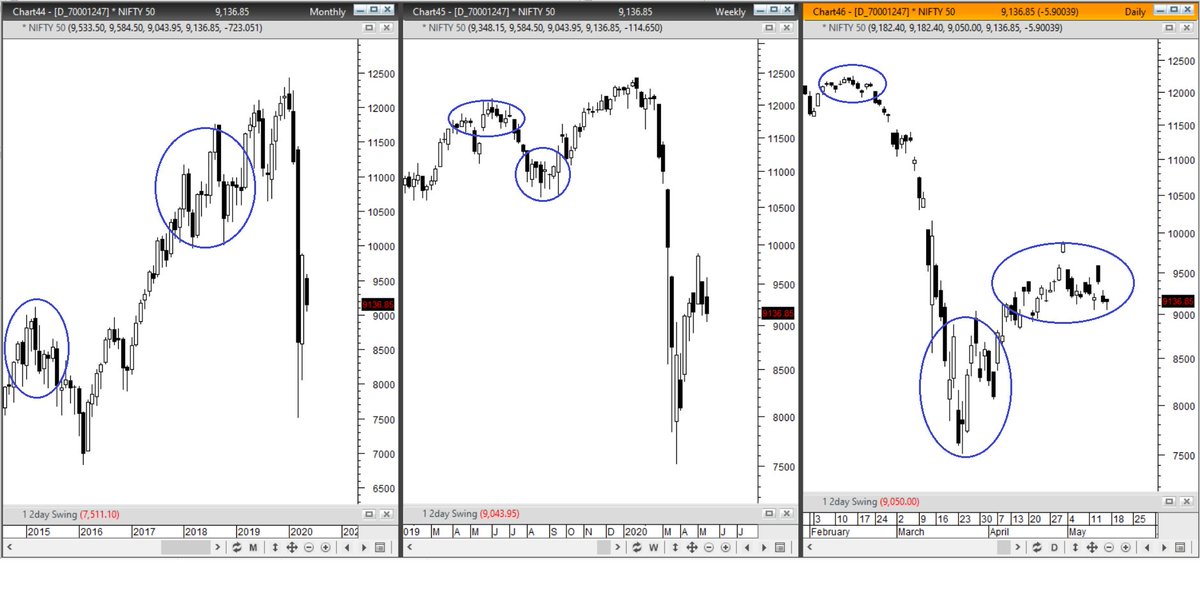
Hence, to clear up the chart clutter and convert it into a simple one for a understanding of only chart patterns we have
Option 1: Use only Closing Line chart
Option 2: Use 1 data point of a period (out of OHLC) which is 'more' relevant for the purpose of support / resistance..
Option 1: Use only Closing Line chart
Option 2: Use 1 data point of a period (out of OHLC) which is 'more' relevant for the purpose of support / resistance..

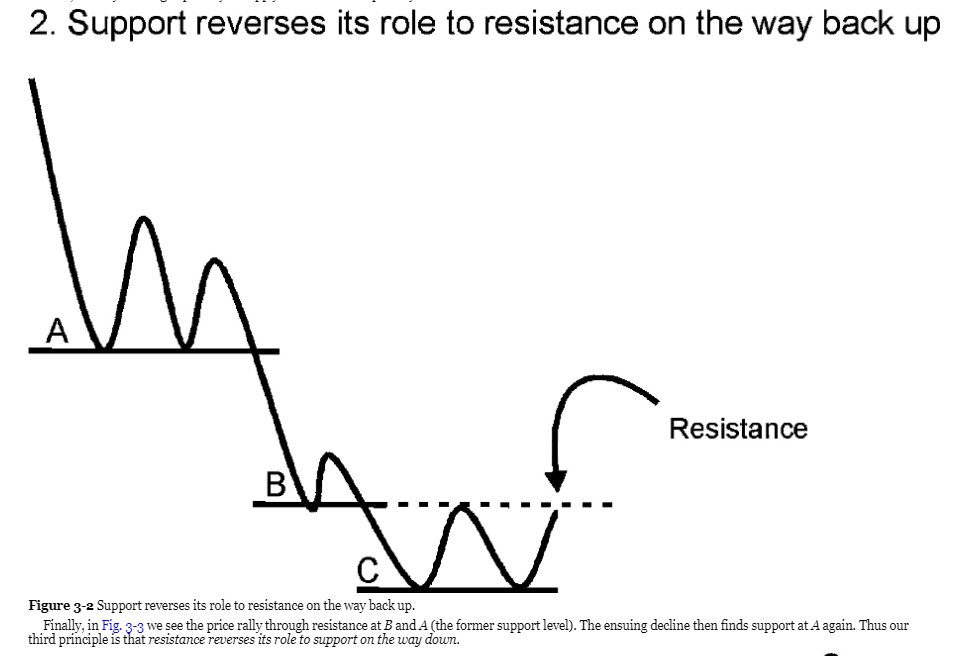
I chose Option 2: I feel Highs & Lows r important to consider as on a broad scale as they help identifying areas where market is struggling / clearing with ease.
Charts shown below uses formula of 2-Day SWING values (use in any timeframe of your choice). Explaining the formula..
Charts shown below uses formula of 2-Day SWING values (use in any timeframe of your choice). Explaining the formula..


Details:
There are 4 types of BARs.
Up Bar: Today's High > Previous day and Low > Prev Day,
Down Bar: Today's High < Previous day and Low < Prev Day,
Inside Bar: Today's High < Previous day and Low > Prev Day and
Outside Bar: Today's High > Previous day and Low < Prev Day..
There are 4 types of BARs.
Up Bar: Today's High > Previous day and Low > Prev Day,
Down Bar: Today's High < Previous day and Low < Prev Day,
Inside Bar: Today's High < Previous day and Low > Prev Day and
Outside Bar: Today's High > Previous day and Low < Prev Day..
to consider only 1 data from OHLC,it depends on day "type":
Up / Down / Inside / OutSide...
Data Point selected:
-High when UP
-Low when Down
-Previous day's value when INSIDE
-High when previous day was High & Today is Outside
-Low when previous day was Low & Today is Outside
Up / Down / Inside / OutSide...
Data Point selected:
-High when UP
-Low when Down
-Previous day's value when INSIDE
-High when previous day was High & Today is Outside
-Low when previous day was Low & Today is Outside
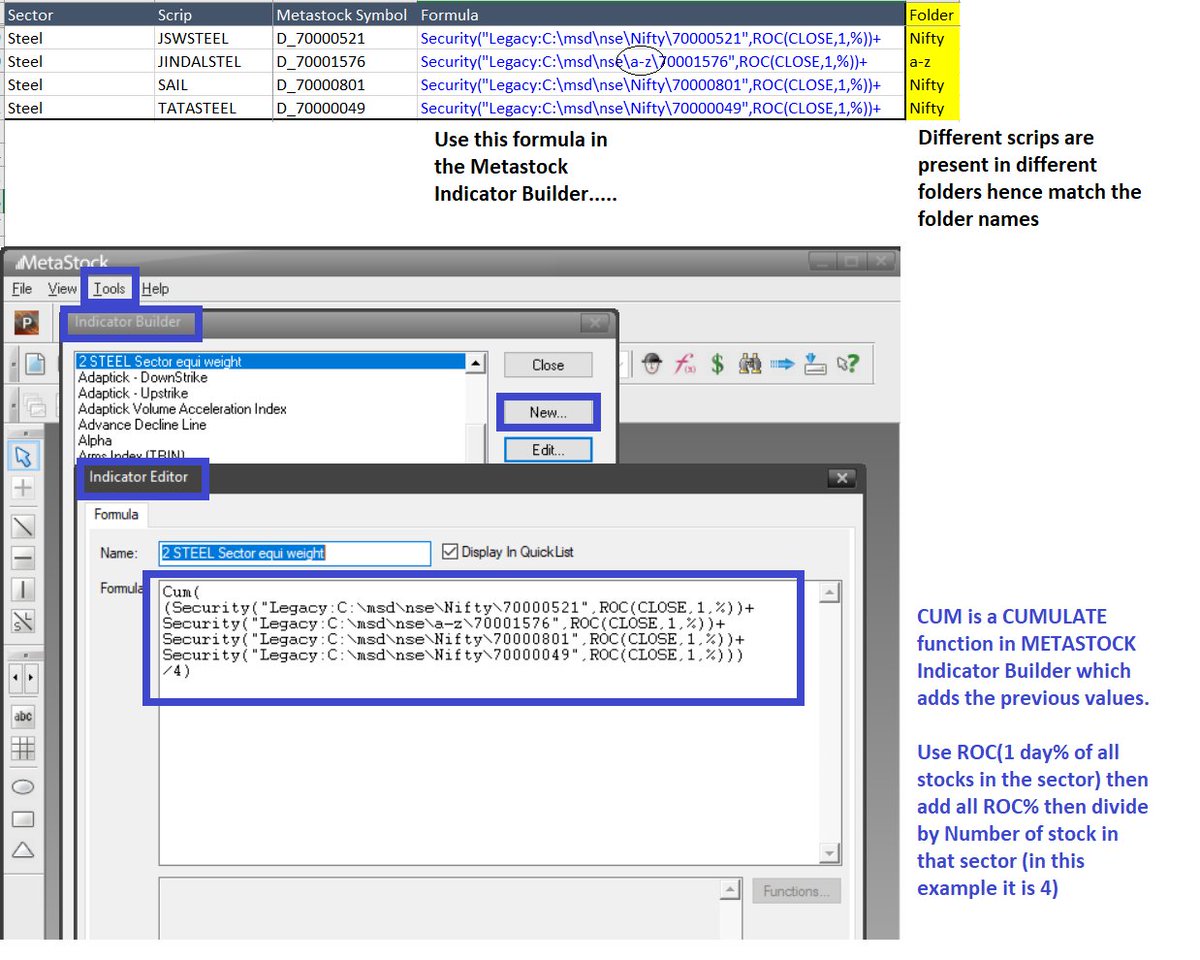
Metastock Indicator formula details for above mentioned rules:
(formula could not pasted in single tweet hence screenshot)
*Indicator can be used in anytime frame and useful to identify well defined chart patterns.
(Feedback and suggestions are welcomed)
(formula could not pasted in single tweet hence screenshot)
*Indicator can be used in anytime frame and useful to identify well defined chart patterns.
(Feedback and suggestions are welcomed)


Two Charts I am watching right now:
One for an Uptrend: CADILAHC
One for a Downtrend: COALINDIA
Below are weekly charts of same
One for an Uptrend: CADILAHC
One for a Downtrend: COALINDIA
Below are weekly charts of same

#LetsLearn
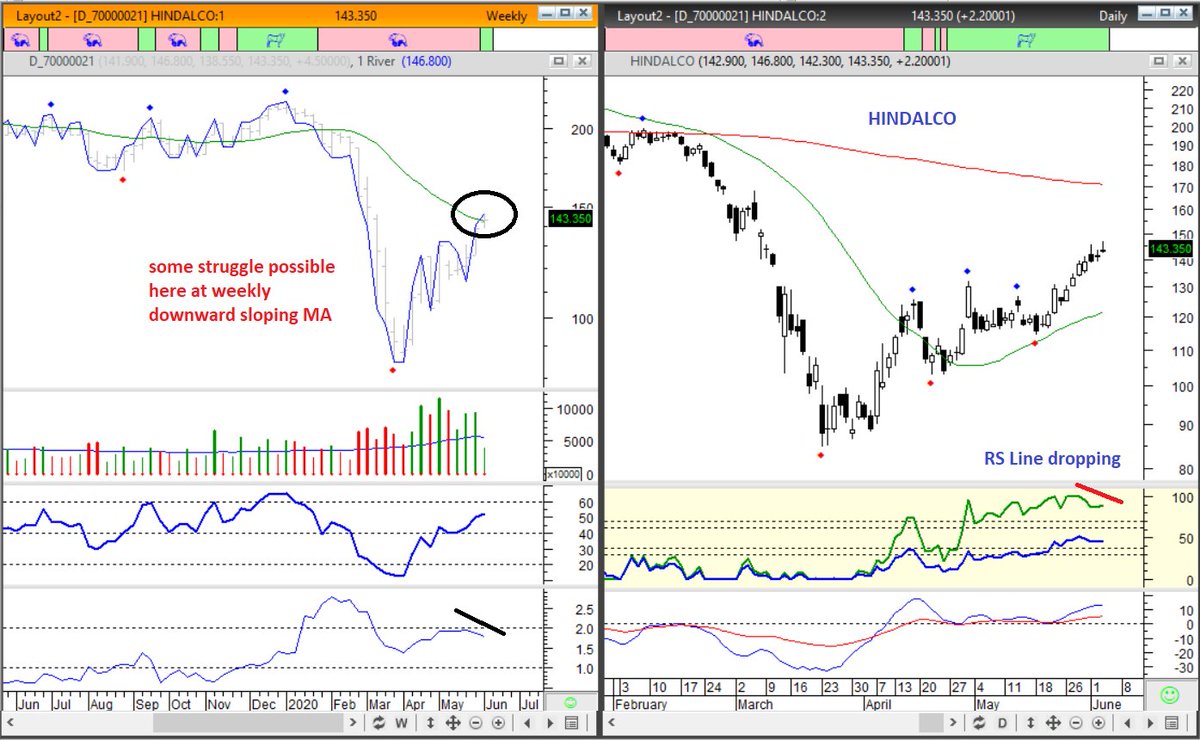
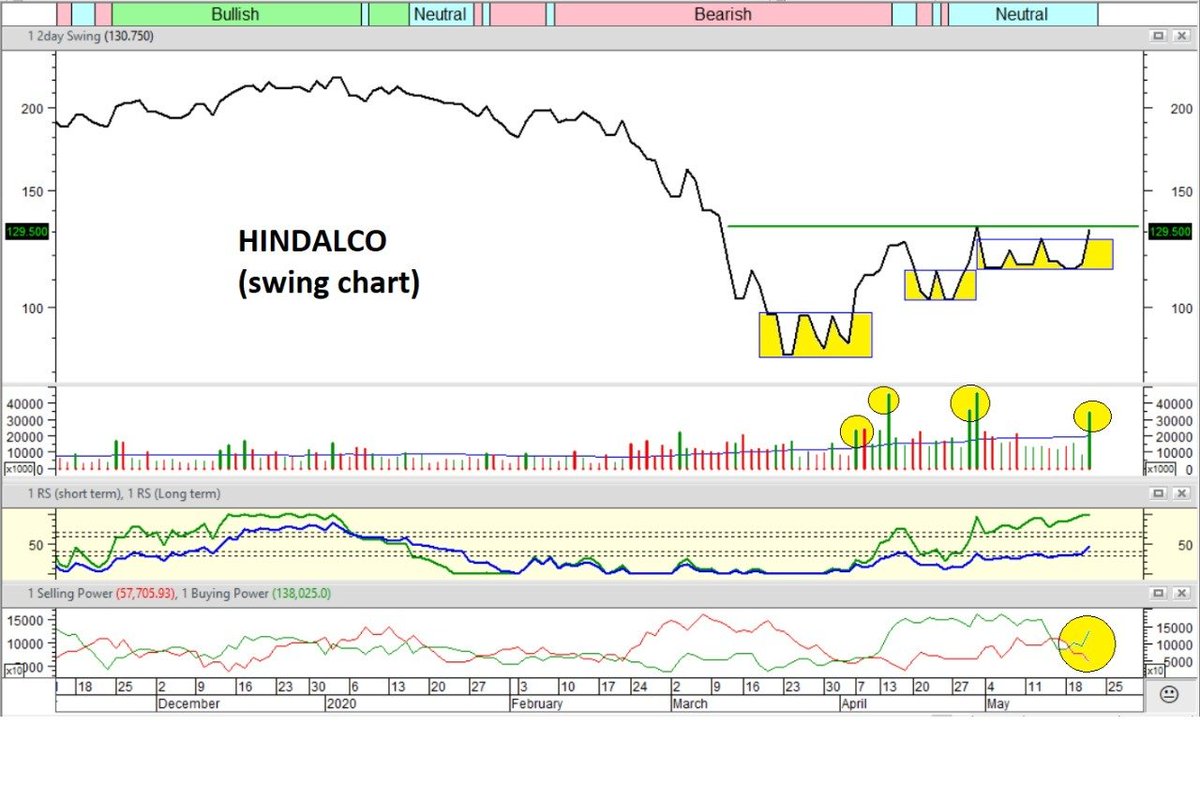
What a clean chart can show in having more clarity...
#HINDALCO Daily chart
* Third attempt of base formation breakout
* Speculative buyers very active here
* Short term RS line is near the roof
* Volume Profile suggests that the stock may clear resistance this time.
What a clean chart can show in having more clarity...
#HINDALCO Daily chart
* Third attempt of base formation breakout
* Speculative buyers very active here
* Short term RS line is near the roof
* Volume Profile suggests that the stock may clear resistance this time.

#Hindalco - example of a chart which should be sold (exit long) at strength...
Logic: RS Line dropping at major resistance zone
Logic: RS Line dropping at major resistance zone