Sumit Verma Profile picture
Trader. Analyst. Studying markets since 2008. Intermarket and Sentiment analysis. Trend follower. Exploring quants. Problem solver. Food lover. Movie buddy.
Jun 22, 2020 12 tweets 8 min read
It is said that Bull Market climbs the wall of worries...

Happening across many markets...

#Copper is one of them too..
Chart Pattern resembles an old one from history

Post 5th breakout higher high, S&P never looked back. ImageImage Updated chart of #Copper...

Today at 5th Breakout level ImageImage
Jun 16, 2020 52 tweets 37 min read
Lesson from recent past.

BALAKOT Airstrike did not trouble market much, I am confident that Indo-China border tussle may not too.

Note: 20 day Average True Range for #NIFTY is 260pts (CMP 9914)

Hence, will maintain 9600 as trigger level to change stance. #NIFTY Update on #Nifty chart

4th Higher High formation
No weakness in volume to assist divergence
20Day ATR now 250pts (ATR falling means low volatile zone in an Uptrend which is bread butter for Trend Followers)

My view: Bullish as there is no sign of weakness yet.

TREND is UP Image
May 26, 2020 5 tweets 3 min read
Today headline Index was weak but breadth was pretty good both on price as well as volume side. #Nifty Image Breadth do speak.. we just need to hear them well.. #Nifty Image
May 23, 2020 7 tweets 5 min read
#LetsLearn

Earlier I explained how to make charts cleaner by using Two day Swing Lines & today I explained how to identify Relative Highs & Relative Lows in an objective manner
Link1:

Link2:

1/n
#LetsLearn

Now I will try to show how to make a TRADING system out of the two....

Tools used:
Relative High AND Low identifier (N=10) and
Two day Swing Lines

.....2/n
May 23, 2020 10 tweets 8 min read
A thread on how to Define correct Swing Highs / Lows for the purpose of Dow Theory analysis or drawing Trendlines:

Thomas DeMark in his book "The New Science of Technical Analysis" said that drawing
of trend lines is a highly arbitrary process. 1/n A trend line is typically intended to connect
several Relative Highs or Relative lows. If there are two or more such points, the trend line can be drawn
precisely. (notes from Jack Schwager's book "The Complete Guide to the Futures Market").. 2/n
May 17, 2020 12 tweets 6 min read
Further to my initiative of #LetsLearn where my objective is to de-code complex things & make things simple and available for analysis...
Today, I will try to make a complex looking chart into a clean & simple one (only useful for people who are PATTERN based trader/analyst)..1/n amazon.in/Pring-Price-Pa…

Further as disclaimer, the presented way will be more useful for people who have followed Martin Pring's book on chart patterns.. (images taken from Kindle version of the book)
May 15, 2020 6 tweets 4 min read
#LetsLearn

This is how see / read through #FII data.. (Participantwise category)

Quantum of Buying / Selling in. cash Market + Index Futures + Stock Futures.
How the flows are basis last 3 days? How the flows are basis current week? It give an indication which camp is strong Updated ..

#LetsLearn
May 11, 2020 5 tweets 4 min read
Starting a new series of #LetsLearn wherein I will try to present few interesting techniques in charting softwares where we can use our creativity to see different things:
cont..
@JainSumeetS @purohitjay @entrepreneur987 tagging u so that it reaches maximum people who can benefit Topic 1: How to create Equi Weighted Charts in METASTOCK?

in F&O there r many stocks with different sectors, to create a sector chart of our own we need Symbols (example here is STEEL sector stocks) then form the formula given in the screenshot. Self explanatory.

#LetsLearn
May 4, 2020 4 tweets 3 min read
Few observations on #Accumulation pattern in #BHEL

Interesting to see how multiple things add up when price is near inflection point of new breakout. Lets see how it goes. Image Today's Follow through Volume on the Upside in #BHEL speaks a lot about DIRECTION now...

#Update Image
Mar 18, 2020 12 tweets 9 min read
#Nifty vs #S&P500 of 1987 crash ... high correlated analog.. Image Updated chart with longer vision... #NIFTY in 2020 vs #S&P500 of 1987 Image
Dec 10, 2019 4 tweets 3 min read
#NIFTY 500 Index - weekly chart ... Diamond pattern under construction Image #NIFTY 500 Index chart - Index's reaction at Psychological round number has been similar (5000 vs 10000)... question is will history be repeated.. a Blow-off rally post 10000 from here? (I feel its possible as Market breadth is improving & #Dollar Index at 4 month low)

SL 9570 ImageImage
Dec 3, 2019 5 tweets 3 min read
Negative divergence observed in Breadth oscillator #NIFTY

Implication: Potential Short term correction possible from here on to the tune of 3-5% Image Anticipated correction has started. Even there is reversal in Step & Ladder chart. #Nifty Image
Dec 3, 2019 5 tweets 3 min read
#COMEX #GOLD potential Bottom formation.

(view negate below $1450) Image Naa ye girr raha hai.. naa baddh raha hai.. sirf tadap raha hai..

#Bullish view intact in #Gold
SL $1459 Image
Nov 4, 2019 10 tweets 6 min read
#NIFTY Close-Open of last 3 days:
31st Oct'19: -13pts (NSE TO: 50.8k crs being expiry day)
01st Nov'19: +4pts (NSE TO: 42.8k crs)
04th Nov'19: +16pts (NSE TO: 40k crs)

Today's high 11989.15

Largecaps arent looking healthy at current levels.

View changes > 12042 Image 
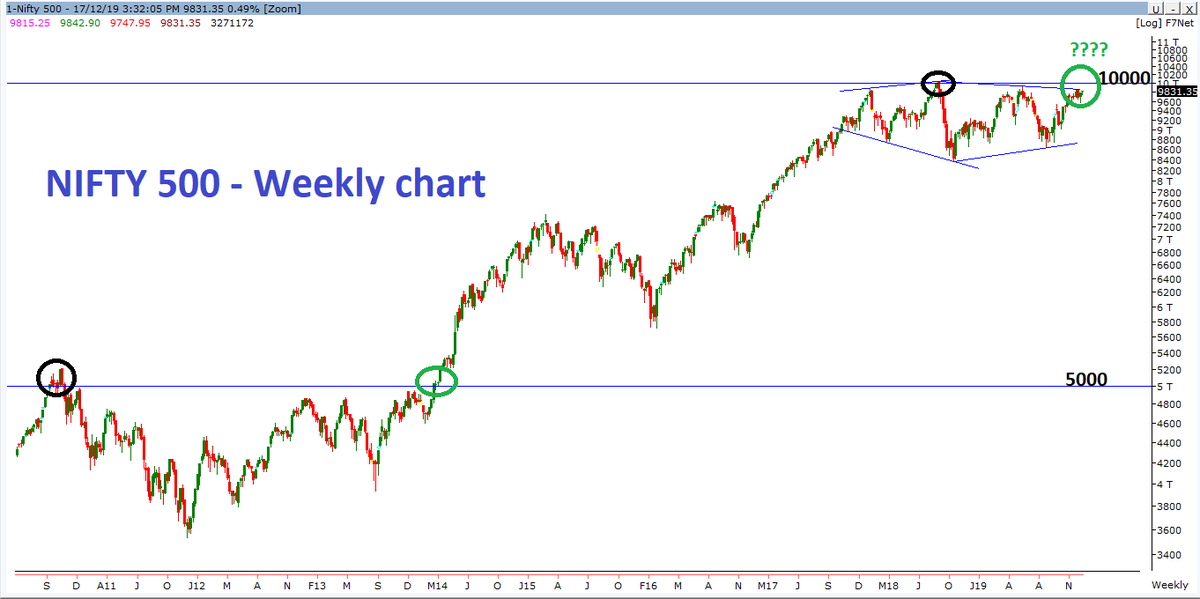
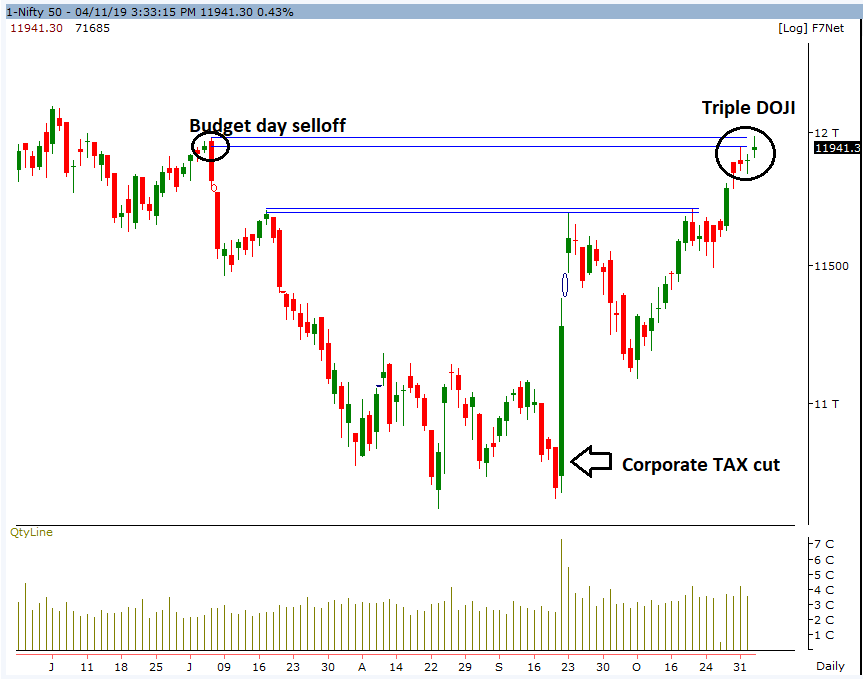
View is intact.. maintain SL 12042..
Today's high was 12002.90

Midcap and Smallcaps are showing some weakness
Breadth wasnt good today despite the rally in Banknifty. ImageImage
Oct 10, 2019 8 tweets 4 min read
#BANKNIFTY Volatility at new 5 year high. Image good start to #BANKNIFTY today.. similar setups like earlier occasion.. should be fast and furious from hereon...
Oct 9, 2019 7 tweets 4 min read
#PSUBANK index - beaten down and oversold makes a case for mean reversion from here. Image #PSUBANK Index is up +3% already from observed level in 3 hours.
Nov 21, 2018 8 tweets 4 min read
#NASDAQ futures - Multiple RSI divergence. Probable mean reversion pullback if closes above 6600 today. Image #S&P500 Futures also at crucial support Image
Sep 12, 2018 28 tweets 16 min read
Today 4/5 guys are calling a market Bottom. #Nifty

They must be really smart if that happens. Now at 11375 .... #Nifty .. 5/5 guys are saying Nifty bottom done.
Jun 1, 2018 5 tweets 3 min read
#FTSEMIB Index (ITALY) index formed a inverted Triangle pattern which is bearish for medium term. Current pullback may halt and reverse from / near 50% retracement zone. Image #FTSEMIB struggling to cross 38.2% retracement also. Timewise after 16 day's of decline and pullback of 4-8 days; if it fails to cross 50% retracement mark then can trigger fresh round of sell off. #ITALY Image
May 24, 2018 6 tweets 3 min read
Sometimes.... some charts.. are just so close to TEXTBOOK style patterns.

#FTSE100 Image Update on #FTSE100 chart.

Richard W. Schabacker in his Book "Technical Analysis and Stock Market Profits" calls this pattern an INVERTED TRIANGLE. ImageImage
May 9, 2018 10 tweets 6 min read
#TechnicalAnalysis #S&P500 chart
I was convinced that TEXTBOOK patterns are things of the past and then this happened. #Triangle #Elliottwave

all negative sentiments factored in? Image #
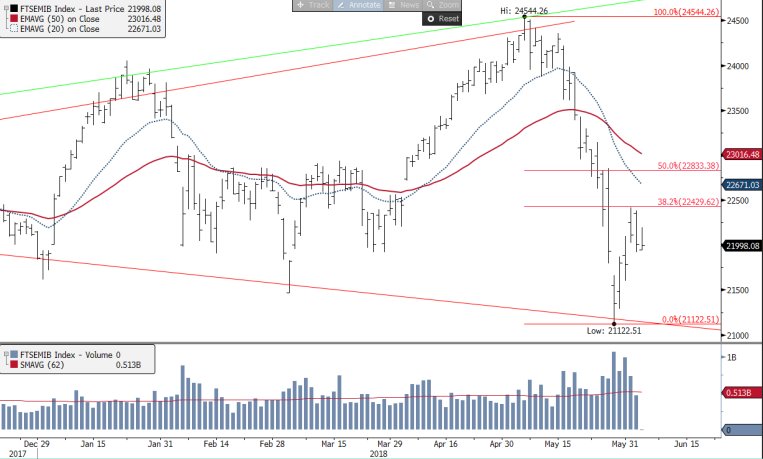
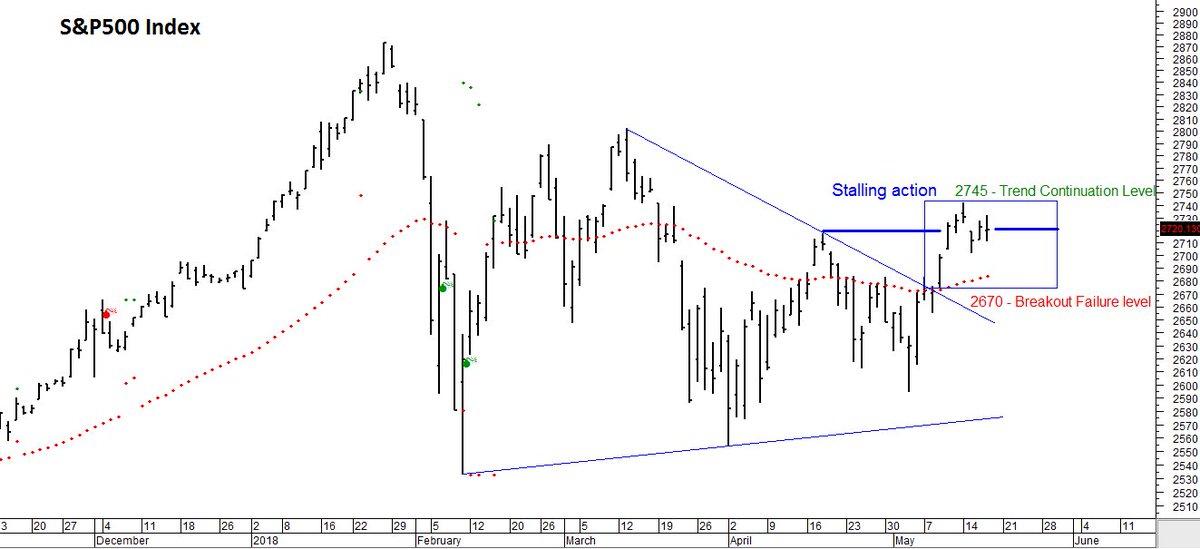
S&P500 chart update.
Stalling action after a breakout from a more than two month old pattern is never a good sign.

Levels mentioned for view going forward in the chart. Image