#LetsLearn
Earlier I explained how to make charts cleaner by using Two day Swing Lines & today I explained how to identify Relative Highs & Relative Lows in an objective manner
Link1:
Link2:
1/n
Earlier I explained how to make charts cleaner by using Two day Swing Lines & today I explained how to identify Relative Highs & Relative Lows in an objective manner
Link1:
Link2:
1/n
#LetsLearn
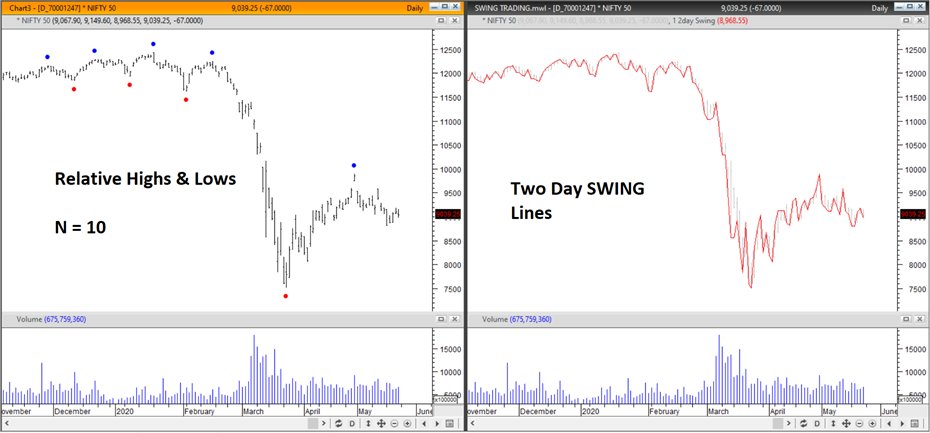
Now I will try to show how to make a TRADING system out of the two....
Tools used:
Relative High AND Low identifier (N=10) and
Two day Swing Lines
.....2/n
Now I will try to show how to make a TRADING system out of the two....
Tools used:
Relative High AND Low identifier (N=10) and
Two day Swing Lines
.....2/n
#LetsLearn
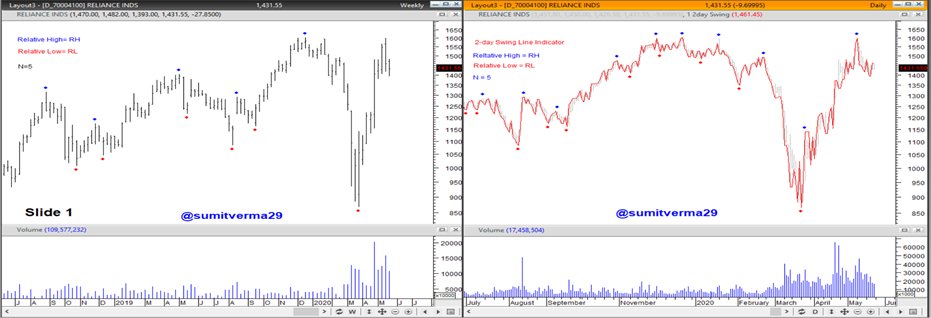
Further to the above thread to find trade setups using the above mentioned tools.
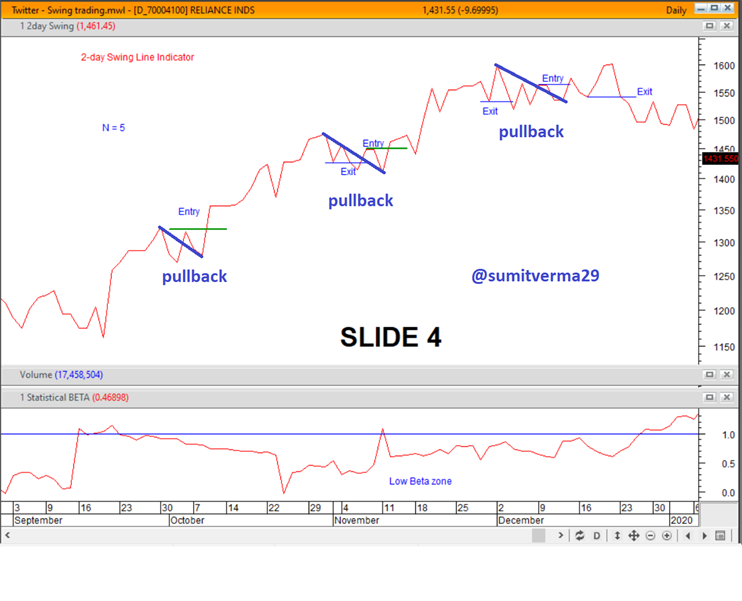
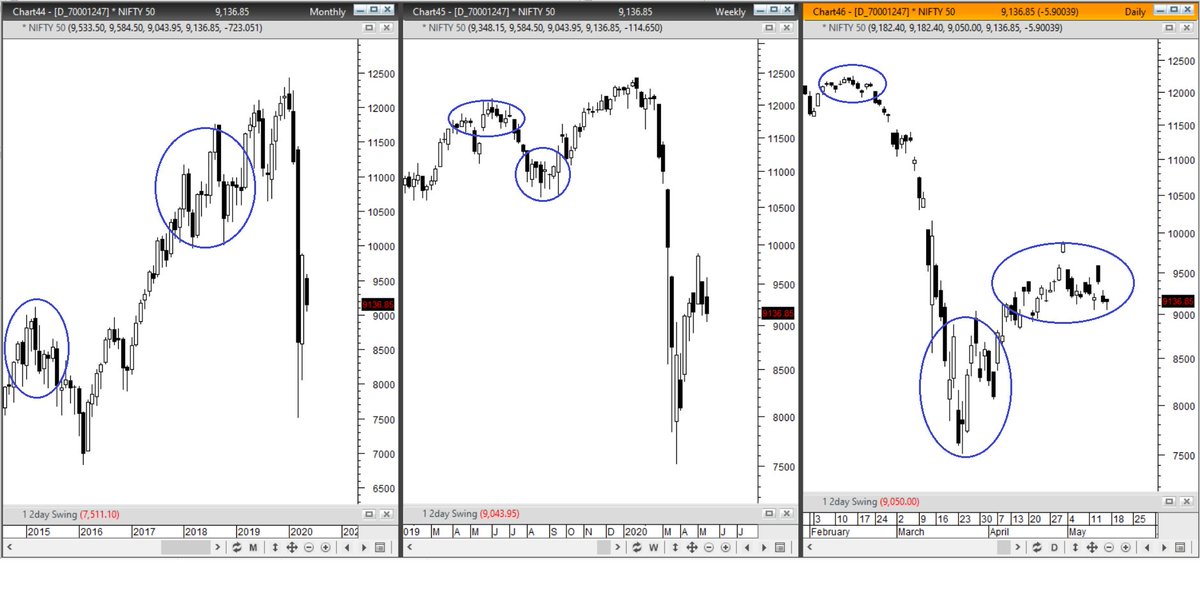
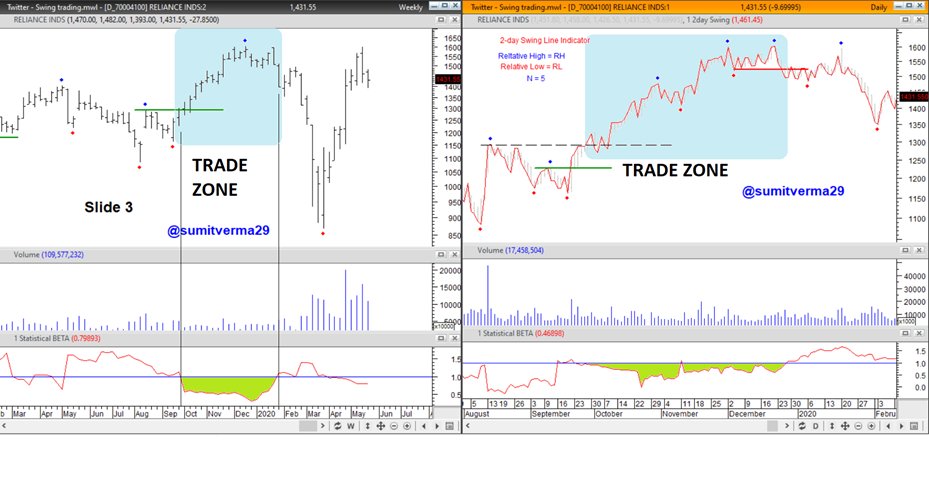
Topic: Identifying "TREND FOLLOWING trade setups" using Top-Down approach
- Weekly and Daily charts are taken with Relative Highs and Relative Lows marked (parameter N=5)
..contd..
Further to the above thread to find trade setups using the above mentioned tools.
Topic: Identifying "TREND FOLLOWING trade setups" using Top-Down approach
- Weekly and Daily charts are taken with Relative Highs and Relative Lows marked (parameter N=5)
..contd..
#LetsLearn
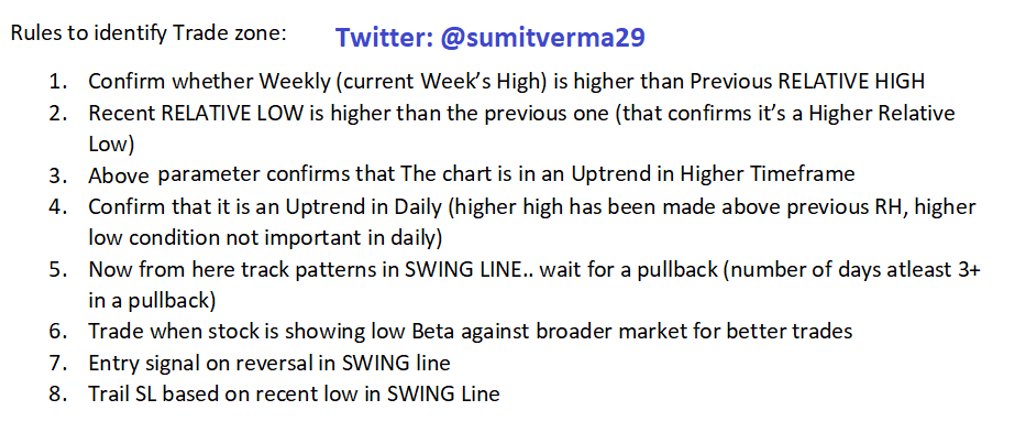
- Below are the rules followed to find the trade setup
- Charts for same attached in order of sequence
Contd....
- Below are the rules followed to find the trade setup
- Charts for same attached in order of sequence
Contd....
#LetsLearn
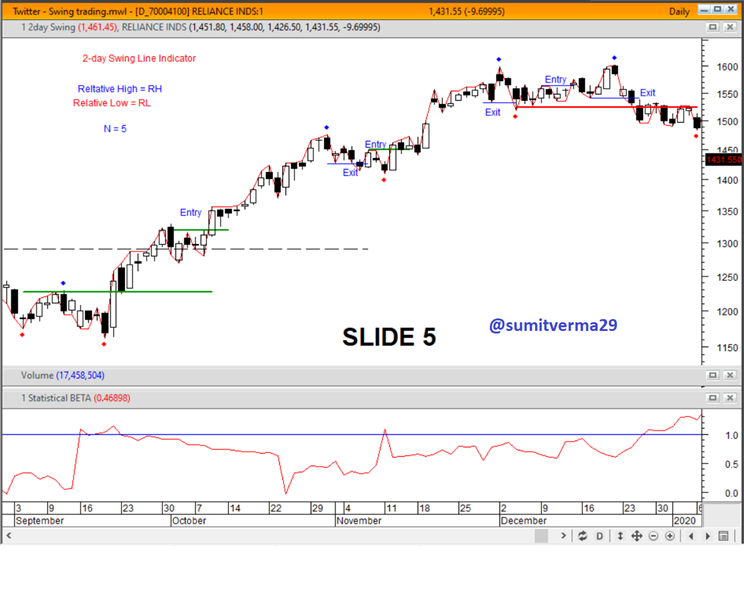
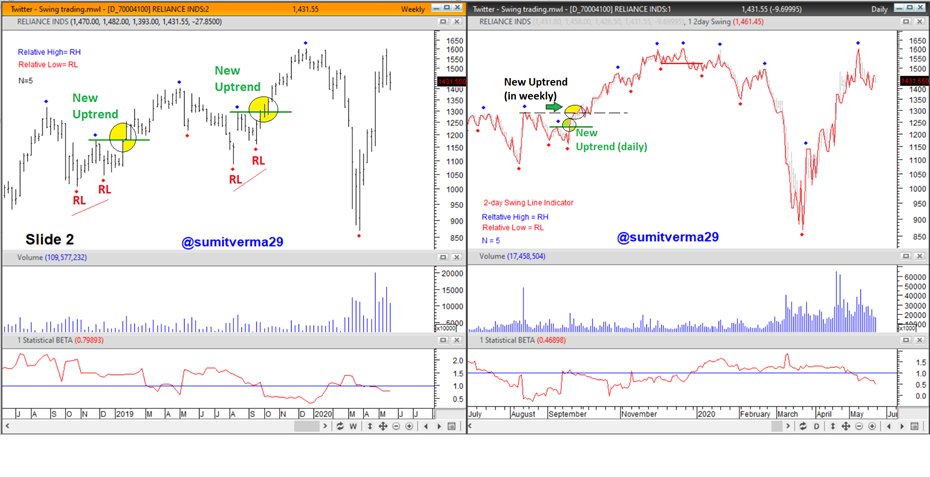
Final Picture
*Most imp is the ZONE to select for trading. Better trade setups appear in lower beta zone in largecap when N=5 is used. For Midcaps, N=10 works better due to beta factor.*
Many more concepts on pipeline to be explained under #LetsLearn...
Stay tuned..
Final Picture
*Most imp is the ZONE to select for trading. Better trade setups appear in lower beta zone in largecap when N=5 is used. For Midcaps, N=10 works better due to beta factor.*
Many more concepts on pipeline to be explained under #LetsLearn...
Stay tuned..