Samuel did the main study underlying the #8cantwait policies, the subject of much debate lately. I wanted to see if his results could be replicated.
Spoiler: in cities with 0-2 of the policies, you're 44% more likely to be shot by police than in cities with 6-8 of them.
/1
Spoiler: in cities with 0-2 of the policies, you're 44% more likely to be shot by police than in cities with 6-8 of them.
/1
I'm replicating, not reproducing, so I'm intentionally not doing what he did. He did a binomial regression for each policy compared to police shootings from 01-JAN-2015 to 15-JUL-2016. I'm doing a hazard ratio for 01-JAN-2018 to 05-JUN-2020. Different data, different analysis. /2
The only part I relied on Samuel / 8cantwait for is their list of the current policies in place. He is quite right: this info is very difficult to obtain. Most departments do not make it easy. I have no reason to doubt their info. Here's an example. /3 useofforceproject.org/#review 


#8cantwait isn't a silver bullet nor an end solution, it's a set of concrete policies for immediate harm reduction.
I wanted a robust statistical analysis of good policies versus bad, so I treated bad police policies like a toxin or pathogen. /4
I wanted a robust statistical analysis of good policies versus bad, so I treated bad police policies like a toxin or pathogen. /4
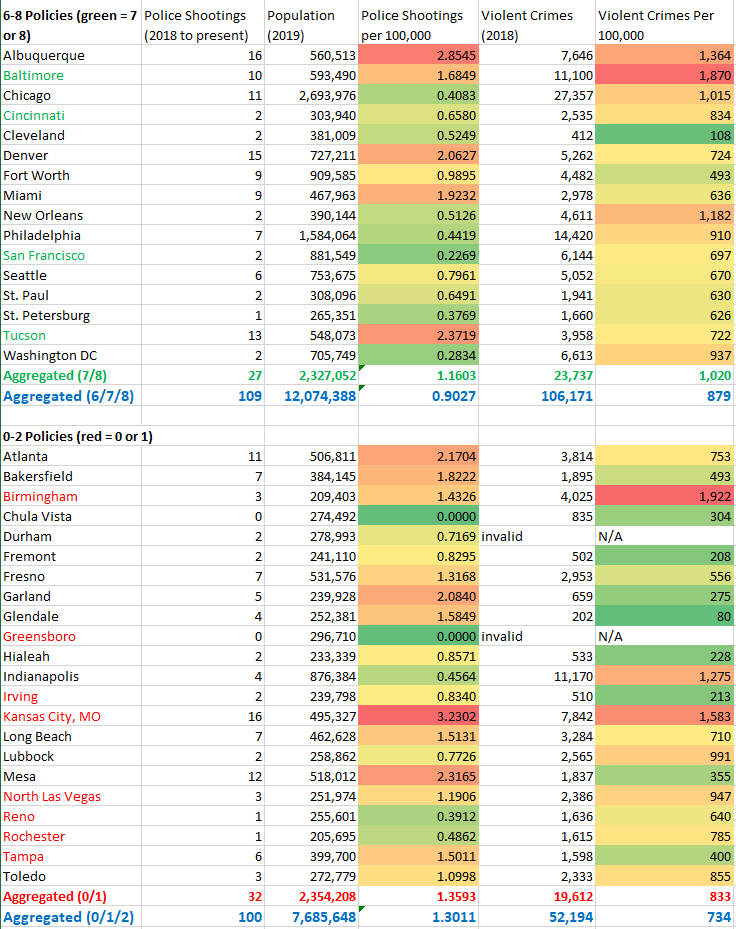
I also wanted it to be statistically robust, so I set a goal: at least 10 cities & 3 million people in each group, good and bad. Comparing cities with 7 or 8 policies versus 0 or 1 wasn't quite enough, so I compared cities with 6/7/8 versus 0/1/2.
Data from WaPo & Census.
/5
Data from WaPo & Census.
/5


There's of course outliers in both groups, but the trend is clear: police in cities with 0, 1, or 2 of the #8cantwait policies shoot more people per capita than those with 6, 7, or 8 all of the policies. (Same is true for 0/1 vs 7/8, but, again, caveat: smaller sample size.) /6

And if you're going to be super clever and say, "ah ha, but those cities are more violent!" yeah just don't do that. They're less violent, per latest full FBI data: ucr.fbi.gov/crime-in-the-u…
(North Carolina fails to report violent crime data properly; FBI doesn't use it either.)/7
(North Carolina fails to report violent crime data properly; FBI doesn't use it either.)/7

Like I said, I analyze bad police policies like a pathogen: if a city has 0/1/2 of the #8cantwait policies, the residents are exposed. If a city has 6/7/8 of the policies, the residents are not. Here's the math. The odds ratio & rate ratio are both 1.441 (95% CI: 1.097-1.891).
/8
/8


To put that in less mathematical terms: in cities with 0-2 of the policies, you're 44% more likely to be shot by police than in cities with 6-8 of them. Exactly 44% more likely? "Exactly," no, but significantly more likely, somewhere between 9.7% and 89.1% more likely. /9
Will someone roll into the replies with a bunch of jargon and objections? Yes, just like the drug companies & toxic polluters do, you can always throw words at a statistics and claim you're not satisfied while refusing to do your own analysis. I'm satisfied. #8cantwait works. /10
As to whether #8cantwait imperils efforts to abolish / defund the police or decriminalize our society and the like, I don't think it does, I think it's at least complementary, and that systemic change is usually preceded by minor reform. But that's another thread. /end