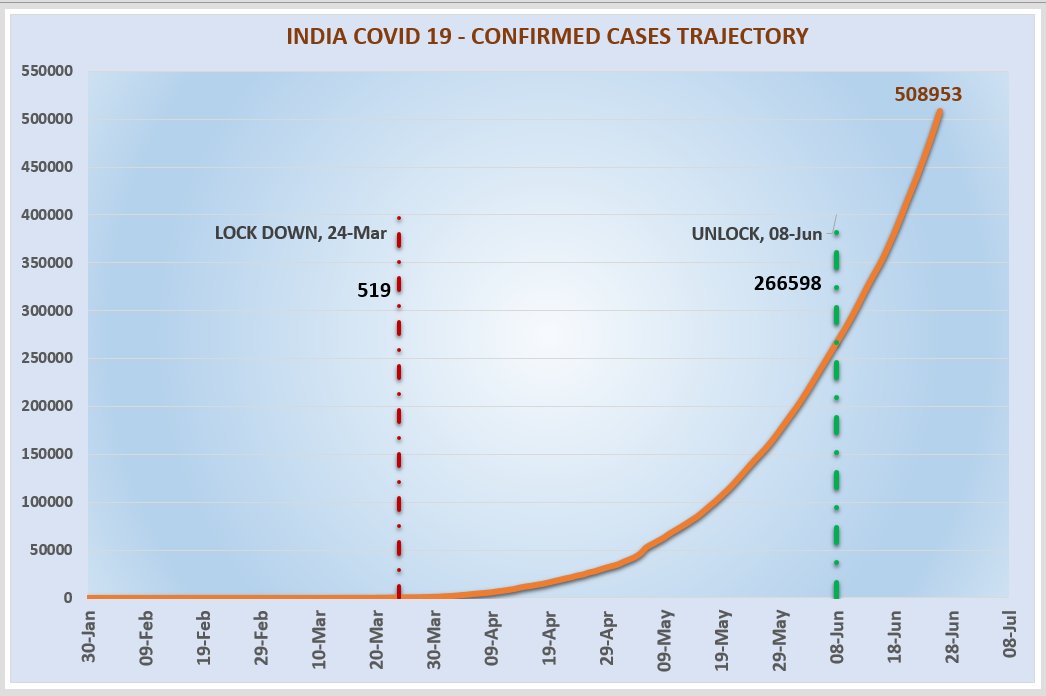
India's #COVID19 trajectory
1 to 1 lakh cases: 139 days
1 lakh to 2 lakh cases: 16 days
2 lakh to 3 lakh cases: 11 days
3 lakh to 4 lakh cases: 9 days
4 lakh to 5 lakh cases: 7 days
Graph plotted with our lockdown and unlock dates & infection data
1 to 1 lakh cases: 139 days
1 lakh to 2 lakh cases: 16 days
2 lakh to 3 lakh cases: 11 days
3 lakh to 4 lakh cases: 9 days
4 lakh to 5 lakh cases: 7 days
Graph plotted with our lockdown and unlock dates & infection data
If someone is saying that our doubling rate is reduced, please don't fall for such arguments, which is nothing but trying to avoid the elephant in the room.
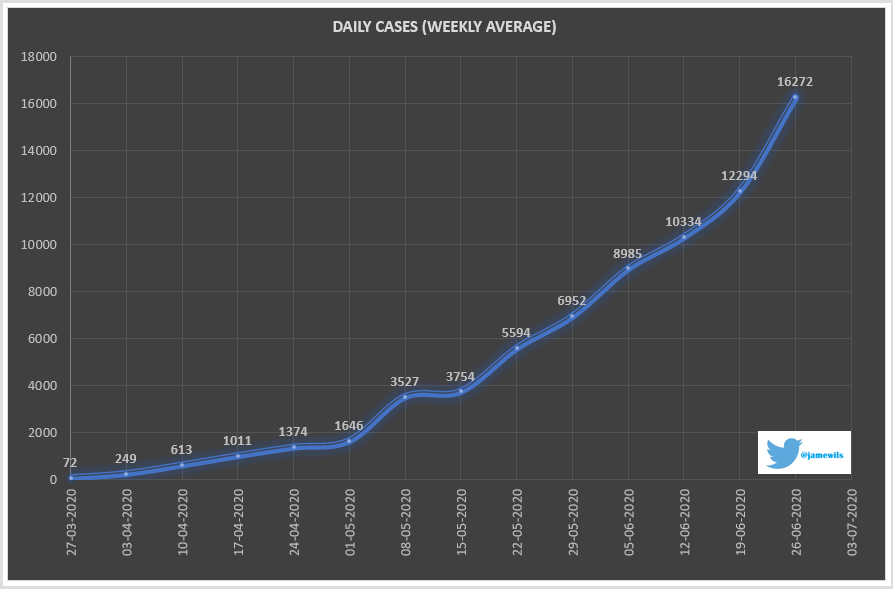
Look at this graph to know how our average weekly infection rates are changing..
The steepness of the curve is worrying!
Look at this graph to know how our average weekly infection rates are changing..
The steepness of the curve is worrying!
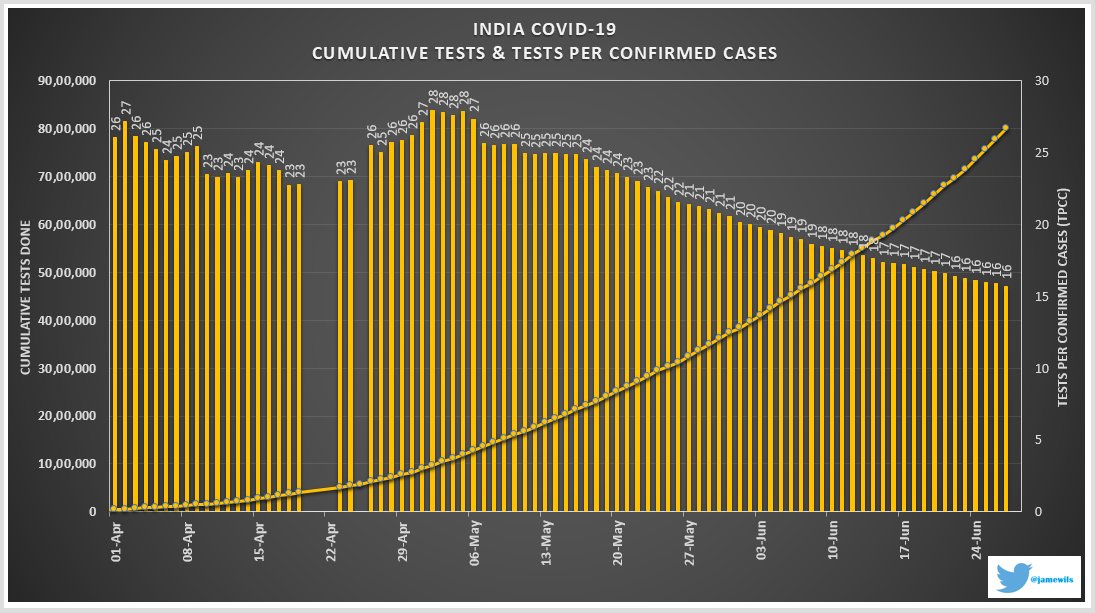
Also let that sink in as we increase the number of tests, the tests per confirmed cases (TPCC) is also falling, not even getting constant...it is falling as days pass!
Means as we test more and we find MORE CASES & we yet to cover the infected zones fully.
BE SAFE FRIENDS!
Means as we test more and we find MORE CASES & we yet to cover the infected zones fully.
BE SAFE FRIENDS!