There is a big debate about whether the US 2nd wave is totally different from the first wave. We test much more. The infected skew much younger. We have better treatment. But does that mean that we have to worry much less?
Some observations (about fatality ratios) = THREAD
Some observations (about fatality ratios) = THREAD
There is a lot of focus on the divergence between the trend in new cases (dramatic acceleration) and the relative stability of fatalities at the national level. This basic picture is shown via a @businessinsider chart, but many version of this is being used, incl by policymakers) 
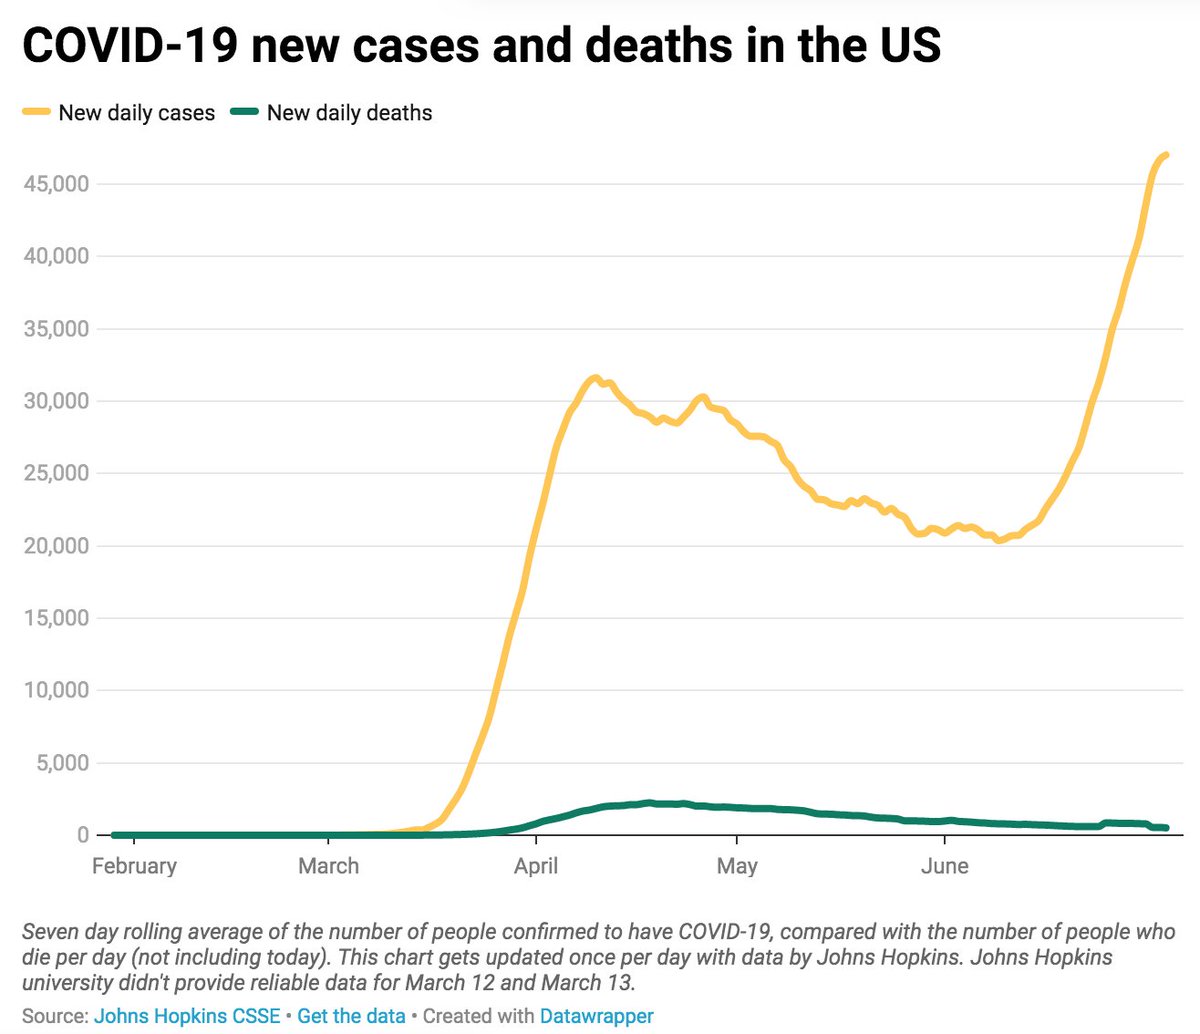
What does the @businessinsider chart show:
In the 1st wave, new cases peaked around 32K per day, and deaths peaked (slightly later) at around 2000 per day.
In the 2nd wave, new cases are running near 50K per day, and deaths are running at 'just' 500 per day.
In the 1st wave, new cases peaked around 32K per day, and deaths peaked (slightly later) at around 2000 per day.
In the 2nd wave, new cases are running near 50K per day, and deaths are running at 'just' 500 per day.
Does the relatively low current number of fatalities mean that the worst is truly behind us?
The answer is unfortunately 'NO'. Let me illustrate:
The answer is unfortunately 'NO'. Let me illustrate:
First, we can already see that fatalities are picking up in certain states and counties (but you have to look at the disaggregated data, since the national data is still dominated by NY).
For example, Arizona, already has more deaths in the second wave than in the first.
For example, Arizona, already has more deaths in the second wave than in the first.

Arizona was the first state to see accelerated case growth 4-6 weeks ago. But other states, such as Texas are seeing their fatalities pick up too, and are likely to see the 2nd wave number eclipse the first in the next 1-2 week

We can look at the fatality information at the even more disaggregated level (counties) and we can see that fatalities are already well above the 1st wave in some countries, although not all (fatalities = read line on right axis)

Second, while fatality ratios (the amount of positive tests that convert into fatality) have dropped at the national level, and in many states, it is not true for all states. The ones with the biggest outbreaks have more sticky 'recorded' fatality ratios over the past month.

For example, Florida and Arizona have seen recorded (CFRs) fatality ratios stabilize around 5%, when looking at current fatalities versus new cases lagged about four weeks, which is probably the most appropriate lag period (given lags from infection and lags in recording deaths).
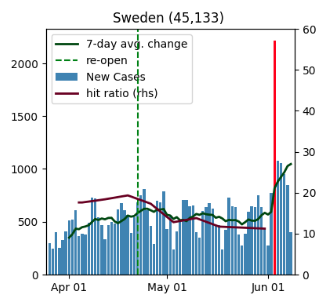
Third, there is a link between positivity rates and fatality rates. The states who test a lot and capture most of the outbreak will have low measured fatality rates. The states with lagging testing will have big unrecorded outbreaks, and therefore high 'recorded' fatality rates.

This means that it is logical to expect relatively elevated fatality ratios to persist in the states that have high positivity rates (hit rates) currently.
(those states are generally at the bottom of the bar chart on the right here: bars >10%)
(those states are generally at the bottom of the bar chart on the right here: bars >10%)
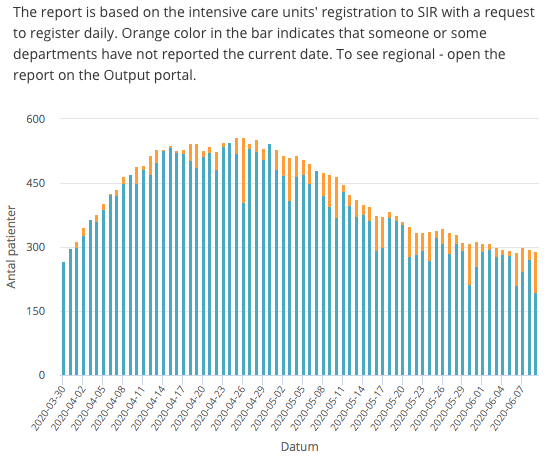
Fourth, hospitalizations are picking up rapidly in certain states, and once you get hospitalized the fatality risk is elevated: that was the case in the 1st wave and remains the case in the 2nd wave [note the picture he is indexed, so only look at trends]
Hence, where should we expect fatalities to go? Focussing on the about 6-8 states with elevated positivity rates or high cases growth, it would be no surprise to see daily fatalities in just those move up to 1000 per day.

I will not do a detailed fatality projection for all 50 states. Fatalities are likely to continue to trend down in NY/NJ and that will help the national figures. But we are still likely to see fatalities move up meaningfully nationally from their recent plateau around 500.
Daily US fatalities above 1000 would be no surprise by end-July as daily fatalities are set to increase in the (6-8) states with accelerating outbreaks currently, with the usual lag.
The 2nd wave is different than the first wave. In some states, the recorded fatality rates (CFRs) are much lower (as we test beyond the very sick). But fatalities will, unfortunately, move up in several states, particularly those with large unrecorded outbreaks.
This thread is not meant to be a detailed point estimate of future US fatalities. But it is meant to highlight that the 2nd wave is just starting; fatalities will catch up with a lag. It is certainly dangerous to relax a lot based the seemingly stable recent trend in fatalities.
The specific trend of fatalities will depend crucially on: 1) how many states are affected by a fast growing 2nd wave, 2) whether any hospital systems get overwhelmed. 3) whether vulnerable parts of the population can better avoid infection (vs 1st wave).
Why this thread? I want to encourage everybody to look at disaggregated data (we put some on @ExanteData each day). The national data is misleading; the disaggregated data, suggests that fatalities are about to increase in various states in the South with the usual lag.
Yes, the 2nd wave is different. And we may avoid an extreme situation like NY had in April. But it will still be a very deadly wave. Daily fatalities doubling from 500 to 1000 is certainly a possibility based on current trends in AZ, TX, FL...
...and it could be worse if a longer list of states lose control of their outbreaks too, with California and Georgia perhaps some of the most important to watch (I think they are still in the grey-zone, although a darker grey than before).
I will leave it at that. The 2nd wave is different than the 1st. But it is still deadly. Fatalities will pick up with a lag, the question is just by how much. Behavior today, will determine whether 2x or more in 4-5 weeks. END.