Nooresh Merani Profile picture
Jul 9, 2020 5 tweets 7 min read Read on X
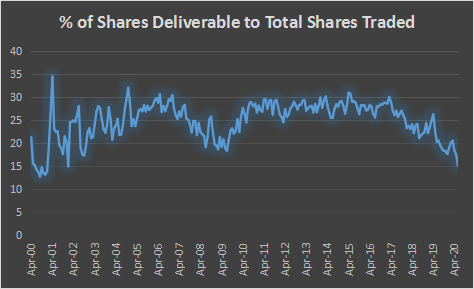
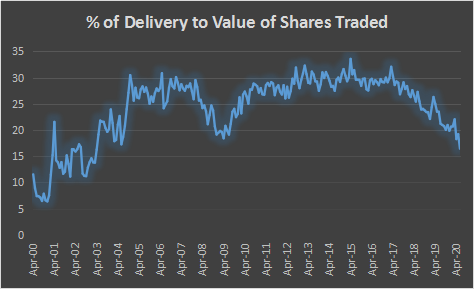
#NSE - Interesting #Statistics - #TweetStorm - •% of Shares Deliverable to Total Shares Traded now at 15.05%. Lowest since 2001. % of Delivery to Value of Shares Traded at 16.44% below 2009 !! #Daytrading increasing or #HFT , #colocation and #marketmaking? ImageImage
Value of Shares Traded ( Cr ) at the Highest Ever. A peak in this generally an Inflection Point for the long term. For example January 08 value got hit in June 09. What is it now ? Image
The Top Traded Counter in 2019-2020 was #RelianceInds which is expected that its the top weight. But 3.24% of total Turnover was #YesBank !! Marginally lesser than 3.61% of #RelianceInds Image
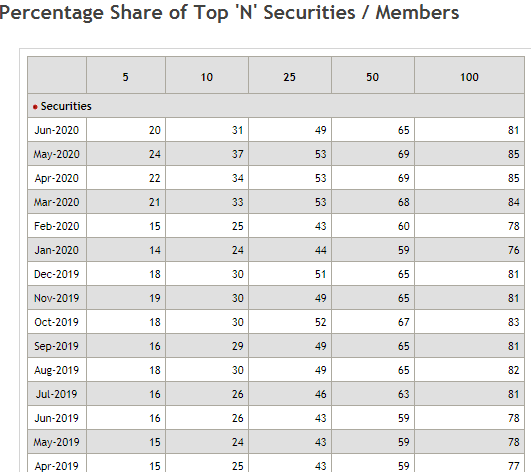
Top 5 brokers are now 20-25% of the Total Volumes. Highest Concentration since 2008. Almost 20-25% of the Trades happening through #MobileTrading. #Colocation trades at 1/3rd of the #Market !! ImageImage
#DiscountBroking seeing new accounts but small value. The highest increase was in #March . #MutualFunds also seeing Retail Interests. Source of images @Nithin0dha & @vivbajaj. End of #TweetStorm. Changing Trends ImageImage

• • •

Missing some Tweet in this thread? You can try to force a refresh
 

Keep Current with Nooresh Merani

Nooresh Merani Profile picture

Stay in touch and get notified when new unrolls are available from this author!

Read all threads

This Thread may be Removed Anytime!

PDF

Twitter may remove this content at anytime! Save it as PDF for later use!

Try unrolling a thread yourself!

how to unroll video
  1. Follow @ThreadReaderApp to mention us!

  2. From a Twitter thread mention us with a keyword "unroll"
@threadreaderapp unroll

Practice here first or read more on our help page!

More from @nooreshtech

Nov 13
Nifty & RSI Positive Divergence

Nifty – Oversold and Triple Divergence

Like I have said in my earlier posts that RSI is a good indicator for bottoming out analysis on Nifty50.

Now is the time with RSI being oversold it gets into practice for us.

Oversold and a possible Triple Divergence in making.

In majority of the instances a RSI divergence has led to a Strong Bounce.

A cluster of supports closer to 23300-23600.

Recent lows can be broken tomorrow and ideally one would expect a good bounce from the support band.

The trade is to look for longs in the band of 23300-23600 or as close to it or stock specific.

A bottoming out can take a few sessions as per previous instances. A stoploss of 2% from entry closer to 23000.

A bounce to the tune of 30-50% of the downmove is the initial target. That would come to 24500-25000.Image
The past instances

The 2021-2023 – RSI divergence bounces

Nifty from top to bottom corrected 18% but there were multiple bounces and sideways range.

In the same period many stocks/sectors did really well.

For example the June 2022 bounce was led by Banks.Image
The RSI Divergences in 2015-2016

Although the trend was down there were many bounces.

Textiles/Chemicals and many sectors continued to do well.Image
Read 4 tweets
Sep 28
Nifty50 RSI at 80. Sell Everything and Run Away

Did you all get this Forward/Post of how #Nifty of how 80 RSI was followed by a Correction !!

A Thread.
Image
Image
A) March 1992.

Nifty50 index started in 1996 with a 1-2 year backdated data. NSE started operations in 1994.

So I have no clue where the 1992 data came from. Sensex monthly RSI was 92 in 1992 in 1985. So that also does not match
B) Dec 2003.

My data shows 78.5. But fits the Curve and Narrative.

The next 4 months are sideways. May 2004 elections led to the 30% correction.

So now we start with the actual 80 + RSI instances.
Read 11 tweets
Sep 23
#SEBI - Profit Loss Analysis of #Individuals in #Derivatives

Total Traders = 1.13 cr

93% of #individuals made losses.

Total Loss = 1.8 lakh crores.

Transaction Cost = 50k cr

Only 1% of Traders managed to earn more than 1 lakh!!

A THREAD
1) #Futures Profit But #Options Losses

FY 24 all Individuals

Individuals made losses in Options to the tune of ~ ₹55,000 crore in FY24, they made profits to the tune of about ~ ₹13,400 crore in Futures.
2) But Everyone wants to trade only #Options

FY24

94.2% traded only Options
5.1% traded both Futures as well as Options.
0.7% of the F&O traders traded only Futures.
Read 10 tweets
Aug 6
The Rotational Bull Market !!

This Bull Market has been Unique in terms of No Single Theme being the Leader for a long period.

Read PDF
rb.gy/mo19dw
If we go back in History.

> 1992 was about Cements and other cos driven by Harshad Mehta.

> 2000 was about IT & Telecom – K10 stocks of Ketan Parekh

> 2008 was about Real Estate, Infra etc.
Bear Markets after that saw 60% drawdowns.

Post this period  we have seen more and more Rotational Bull Markets in Sectors/Themes but no Central Leadership.
Read 17 tweets
Jul 10
#Snippets

A few interesting snippets from different notes.

1) DIIs narrowing the gap with FIIs.

Can we see DIIs>FIIs in coming years ? Image
2) #India narrowing the gap with China in MSCI weightage Image
3) Last 5 years Sensex Growth= Earnings Growth

Valuations Expensive or Justified? Image
Read 10 tweets
Dec 31, 2023
Setting the Stage: World Indices Setup for 2024

AEX - NetherlandsImage
ASX All - AustraliaImage
ASX 200 - AustraliaImage
Read 23 tweets

Did Thread Reader help you today?

Support us! We are indie developers!


This site is made by just two indie developers on a laptop doing marketing, support and development! Read more about the story.

Become a Premium Member ($3/month or $30/year) and get exclusive features!

Become Premium

Don't want to be a Premium member but still want to support us?

Make a small donation by buying us coffee ($5) or help with server cost ($10)

Donate via Paypal

Or Donate anonymously using crypto!

Ethereum

0xfe58350B80634f60Fa6Dc149a72b4DFbc17D341E copy

Bitcoin

3ATGMxNzCUFzxpMCHL5sWSt4DVtS8UqXpi copy

Thank you for your support!

Follow Us!

:(