Nooresh Merani Profile picture
Jul 9, 2020 5 tweets 7 min read Read on X
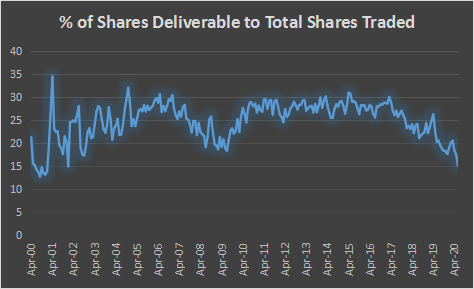
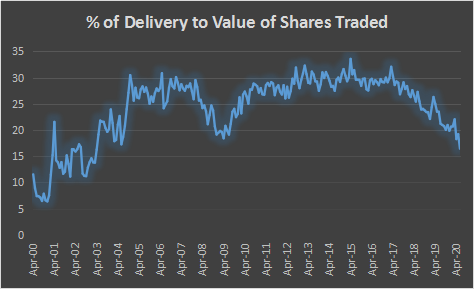
#NSE - Interesting #Statistics - #TweetStorm - •% of Shares Deliverable to Total Shares Traded now at 15.05%. Lowest since 2001. % of Delivery to Value of Shares Traded at 16.44% below 2009 !! #Daytrading increasing or #HFT , #colocation and #marketmaking? ImageImage
Value of Shares Traded ( Cr ) at the Highest Ever. A peak in this generally an Inflection Point for the long term. For example January 08 value got hit in June 09. What is it now ? Image
The Top Traded Counter in 2019-2020 was #RelianceInds which is expected that its the top weight. But 3.24% of total Turnover was #YesBank !! Marginally lesser than 3.61% of #RelianceInds Image
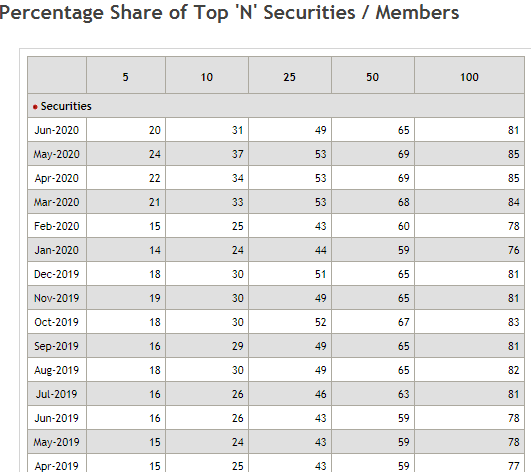
Top 5 brokers are now 20-25% of the Total Volumes. Highest Concentration since 2008. Almost 20-25% of the Trades happening through #MobileTrading. #Colocation trades at 1/3rd of the #Market !! ImageImage
#DiscountBroking seeing new accounts but small value. The highest increase was in #March . #MutualFunds also seeing Retail Interests. Source of images @Nithin0dha & @vivbajaj. End of #TweetStorm. Changing Trends ImageImage

• • •

Missing some Tweet in this thread? You can try to force a refresh
 

Keep Current with Nooresh Merani

Nooresh Merani Profile picture

Stay in touch and get notified when new unrolls are available from this author!

Read all threads

This Thread may be Removed Anytime!

PDF

Twitter may remove this content at anytime! Save it as PDF for later use!

Try unrolling a thread yourself!

how to unroll video
  1. Follow @ThreadReaderApp to mention us!

  2. From a Twitter thread mention us with a keyword "unroll"
@threadreaderapp unroll

Practice here first or read more on our help page!

More from @nooreshtech

Mar 2
#LTCG - #LTCG - Not Much Revenue Gain for Lower Foreign Capital and Market Cap.

A Thread

India is the only country that taxes Foreign Capital
Foreigners own 25.6%
( FPIs= 17.4% & Foreign promoters= 8.2% )

Also when Indian Domestic Money has just started coming in Equity
2) Revenues for Government

This article suggests Long Term Capital Gains collection from Direct Equities was nearly 1 lakh crore.

But there is no Data for only Securities LTCG but this data matches for total LTCG.

Let's see the data.Image
3) Income Tax Data Clubs Equity + Real Estate etc

LTCG announced in Jan 2018.
So that implies AY 2017-2018 or before had no tax on long-term in Equity/MF.

There is still data for LTCG
Implies it's for Real Estate and other AssetsImage
Read 12 tweets
Feb 21
Insider buying / Promoter buying –
What to Look For & What to Avoid ?

A thread 🧵

In simple terms – Insider is someone who knows about the company more than we do – Promoters, Directors and any other connected person with UPSI
Why do we look at Insider Buying ?

👉No risk of Hostile Takeover, Activist Investing in India. More examples of promoters having board control with 5% ownership also.

👉Selling is taken more Negatively ( Much tougher to sell in bear market). So one way entry.

👉So why would a Promoter put more Money & increase Stake. Promoter Cash Flow is too less compared to Market Cap !!
Few Good Reasons that make sense for Promoters

👉Undervalued as Stock has fallen a Lot. ( 400-500 companies saw Insider buying March-May 2020)

👉 Future Potential

👉 Giving exit to Family/Funds/Private Equity etc. (Non operative brother selling)
Read 9 tweets
Feb 9
Multi-Year Range Breakouts in Nifty50 Stocks but Nifty50 Making Lower Tops –What to Do ?

Apart from that

1) Global Indices – US and Europe near all time highs but India continues to struggle and making lower tops.
2) Stocks in Same Sector – One at all time high the other one at 30% drawdown.

3) What to trust the Breakout Moves or Breakdown Moves ?

This creates a dilemma for a Trader – To trust the Breakout/Breakdown or Not ?
Now lets c the Charts

The Struggling Nifty50

Positive divergences on new lows.
Still in lower tops.
Last major swing highs at 24200.
Swing lows at 22800.
Every big positive candle does not see any follow up action over next 1-3 sessions. Wait for this to change.Image
Read 14 tweets
Feb 4
Midcap Over-Ownership & Over-Valuation !!

#Retail Inflows continue to be strong but Sebi categorization of Stocks > 33k cr Mkt cap being considered Midcap has led to over-ownership and overvaluation in the Top Midcap & Smallcap ( > 20k cr )

Data from Monarch AIF Note.
1) Price CAGR >> Earnings CAGR

Nifty50 and Nifty500 have moved inline with earnings cagr.

NiftyMidcap 100 has seen max re-rating. A price cagr of 27.3% against 11.7% earnings. Image
2) Concentrated Flows

Mid + Small + Thematic = 55-60% share of MF pure equity net inflows in CY23 and CY24 Image
Read 10 tweets
Nov 13, 2024
Nifty & RSI Positive Divergence

Nifty – Oversold and Triple Divergence

Like I have said in my earlier posts that RSI is a good indicator for bottoming out analysis on Nifty50.

Now is the time with RSI being oversold it gets into practice for us.

Oversold and a possible Triple Divergence in making.

In majority of the instances a RSI divergence has led to a Strong Bounce.

A cluster of supports closer to 23300-23600.

Recent lows can be broken tomorrow and ideally one would expect a good bounce from the support band.

The trade is to look for longs in the band of 23300-23600 or as close to it or stock specific.

A bottoming out can take a few sessions as per previous instances. A stoploss of 2% from entry closer to 23000.

A bounce to the tune of 30-50% of the downmove is the initial target. That would come to 24500-25000.Image
The past instances

The 2021-2023 – RSI divergence bounces

Nifty from top to bottom corrected 18% but there were multiple bounces and sideways range.

In the same period many stocks/sectors did really well.

For example the June 2022 bounce was led by Banks.Image
The RSI Divergences in 2015-2016

Although the trend was down there were many bounces.

Textiles/Chemicals and many sectors continued to do well.Image
Read 4 tweets
Sep 28, 2024
Nifty50 RSI at 80. Sell Everything and Run Away

Did you all get this Forward/Post of how #Nifty of how 80 RSI was followed by a Correction !!

A Thread.
Image
Image
A) March 1992.

Nifty50 index started in 1996 with a 1-2 year backdated data. NSE started operations in 1994.

So I have no clue where the 1992 data came from. Sensex monthly RSI was 92 in 1992 in 1985. So that also does not match
B) Dec 2003.

My data shows 78.5. But fits the Curve and Narrative.

The next 4 months are sideways. May 2004 elections led to the 30% correction.

So now we start with the actual 80 + RSI instances.
Read 11 tweets

Did Thread Reader help you today?

Support us! We are indie developers!


This site is made by just two indie developers on a laptop doing marketing, support and development! Read more about the story.

Become a Premium Member ($3/month or $30/year) and get exclusive features!

Become Premium

Don't want to be a Premium member but still want to support us?

Make a small donation by buying us coffee ($5) or help with server cost ($10)

Donate via Paypal

Or Donate anonymously using crypto!

Ethereum

0xfe58350B80634f60Fa6Dc149a72b4DFbc17D341E copy

Bitcoin

3ATGMxNzCUFzxpMCHL5sWSt4DVtS8UqXpi copy

Thank you for your support!

Follow Us!

:(