ecoinometrics Profile picture
Jul 20, 2020 7 tweets 4 min read Read on X
#Bitcoin vs SP500 Correlation

1/ Recently #BTC went from uncorrelated to a +0.64 correlation to the stock market.

Without context this could be worrying. So let's have a look... 👇
2/ At the end of February the stock market takes a dive.
Traders are facing margin calls. They sell their hard assets to raise cash.

Naturally #Bitcoin and the SP500 get more correlated. Image
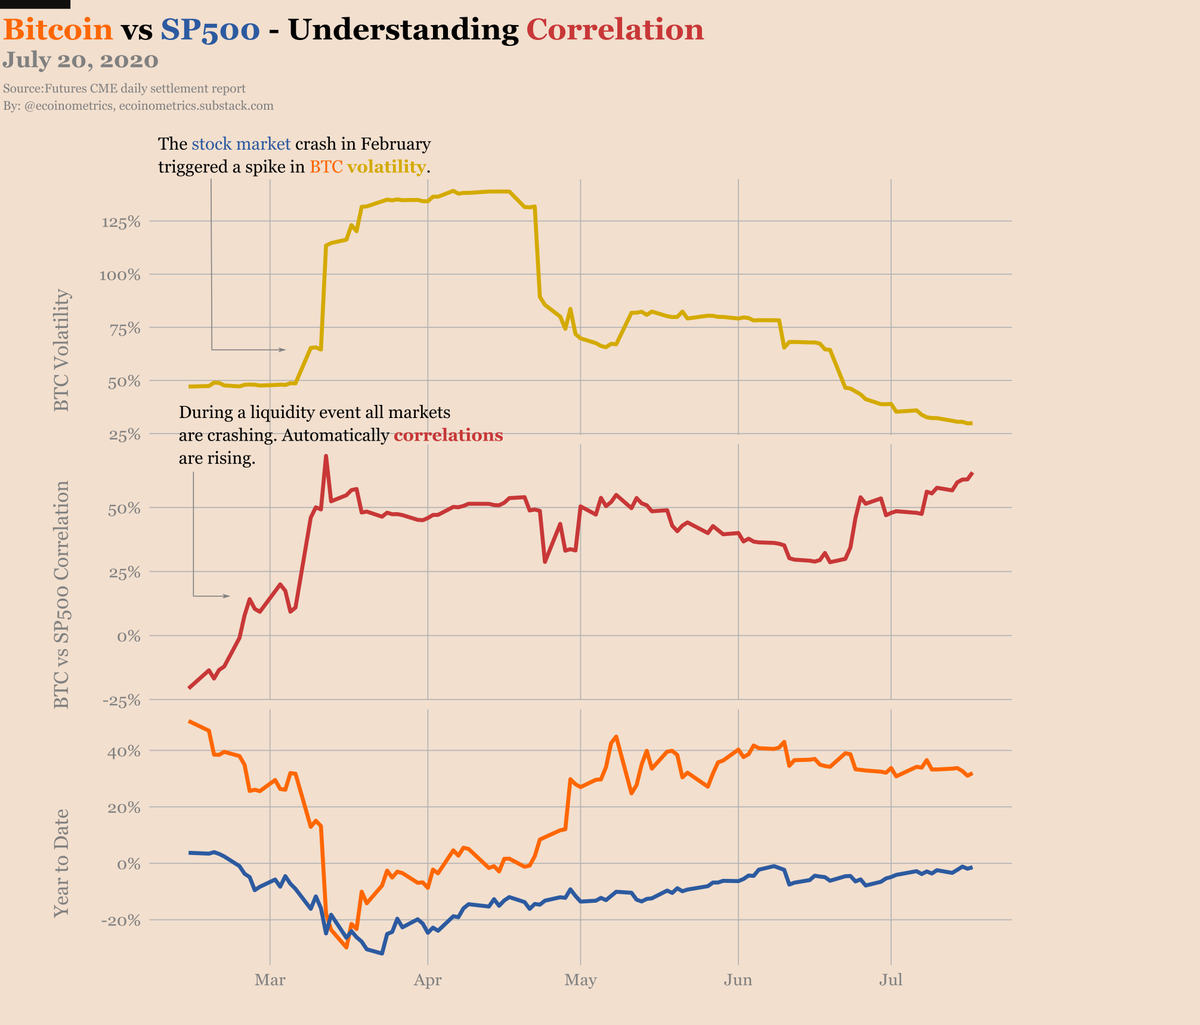
3/ Then the #Fed put kicks in. The stock market starts its rally. At the same time people buy #Bitcoin on the cheap.

Simultaneous rally means again higher correlation than usual. Image
4/ When the rally stalls for both the SP500 and #Bitcoin we actually see a decline in the correlation: back down to almost +0.25. Image
5/ Then #BTC fails to break $10k, gets stuck in a trading range and sees its volatility decline. With that the correlation moves back up.

But we are only a few whale trades away from getting volatility back in the market.

At that point I'd expect the correlation to break. Image
6/ TL;DR #Bitcoin is doing fine. If anything it does behave like a safe haven during a liquidity crisis.

Wait for volatility to come back and we should get an uncorrelated asset once again. Image
7/ For more explanations check out the July 20 edition of the Ecoinometrics newsletter 👇

ecoinometrics.substack.com/p/ecoinometric…

• • •

Missing some Tweet in this thread? You can try to force a refresh
 

Keep Current with ecoinometrics

ecoinometrics Profile picture

Stay in touch and get notified when new unrolls are available from this author!

Read all threads

This Thread may be Removed Anytime!

PDF

Twitter may remove this content at anytime! Save it as PDF for later use!

Try unrolling a thread yourself!

how to unroll video
  1. Follow @ThreadReaderApp to mention us!

  2. From a Twitter thread mention us with a keyword "unroll"
@threadreaderapp unroll

Practice here first or read more on our help page!

More from @ecoinometrics

Dec 20, 2022
If you had dollar cost averaged the SP500 between 2010 and 2020 you'd have made almost twice as much as doing the same thing between 2000 and 2010.

There is always a luck component in the markets. You can't control that. Your job is to play your cards as best as you can.
Here is what you get from DCA the SP500 from 2000 to 2010 to the tune of $150 per week. Image
Here is what you get from DCA the SP500 from 2010 to 2020 to the tune of $150 per week. Image
Read 4 tweets
Nov 4, 2022
The spread between the 10yr and the 2yr US Treasury yield has never been so negative over the past 30 years. Image
The yield curve is actually inverted all the way down to the 10yr vs 3mo spread. Image
The yield curve hasn't been inverted to such degree for a long time. This is a sign that the bond market is anticipating a recession. Image
Read 5 tweets
Oct 6, 2022
Facts about dollar cost averaging:
• How often you DCA doesn’t really matter.
• There is no such thing as a best day to DCA.
• You can lose money with DCA, so choose your asset wisely.

More details 🧵 Image
You can dollar cost average an asset daily, weekly or monthly, over the long run it doesn’t matter.

The only thing that matters is that you are consistent.

Just do it. Image
You might want to “optimize” your dollar cost averaging strategy by picking the best time to buy.

This is pointless. Pick any day of the week to DCA, that makes virtually no difference over the long run. Image
Read 6 tweets
Sep 18, 2022
The Federal Reserve is messing up with the housing market.

The goal: make the average US citizen poorer.

Here is how they achieve that. 🧵
US families typically have the majority of their wealth tied to their home.

As of the last census in 2019, the family's primary residence represents on average 66% of their net worth.
If two third of your net worth is in your house a decline of the real estate market can make you significantly poorer really fast.

That's what the Federal Reserve is trying to achieve.
Read 11 tweets
Sep 17, 2022
Over the last couple of years home prices have done a pretty good job at keeping up with inflation.
At least housing has done a much better job at beating inflation than gold.
But who knows how long this is going to continue. 📉🤔
Read 4 tweets
Sep 4, 2022
Sorry to break it to you, but dollar cost averaging isn’t the ultimate investment strategy.

If you are looking to maximize your return on investment, look elsewhere.

Let's see why and how to improve it.
You all know what dollar cost averaging is. Pick an asset:
- Buy a fixed $ amount of that asset.
- Do that at regular time intervals.

Continue until you are tired of it.
If you started dollar cost averaging the SP500 at $100 per week in 2012 you would now have:
- Deployed $50k.
- For a profit of $27k.
- Or a ROI of 54%.
Read 12 tweets

Did Thread Reader help you today?

Support us! We are indie developers!


This site is made by just two indie developers on a laptop doing marketing, support and development! Read more about the story.

Become a Premium Member ($3/month or $30/year) and get exclusive features!

Become Premium

Don't want to be a Premium member but still want to support us?

Make a small donation by buying us coffee ($5) or help with server cost ($10)

Donate via Paypal

Or Donate anonymously using crypto!

Ethereum

0xfe58350B80634f60Fa6Dc149a72b4DFbc17D341E copy

Bitcoin

3ATGMxNzCUFzxpMCHL5sWSt4DVtS8UqXpi copy

Thank you for your support!

Follow Us!

:(