Thread: Bollinger Bands
Bollinger Bands® is a wonderful invention of John Bollinger.
#Bollingerbands #Indicators #Definedge
Bollinger Bands® is a wonderful invention of John Bollinger.
#Bollingerbands #Indicators #Definedge
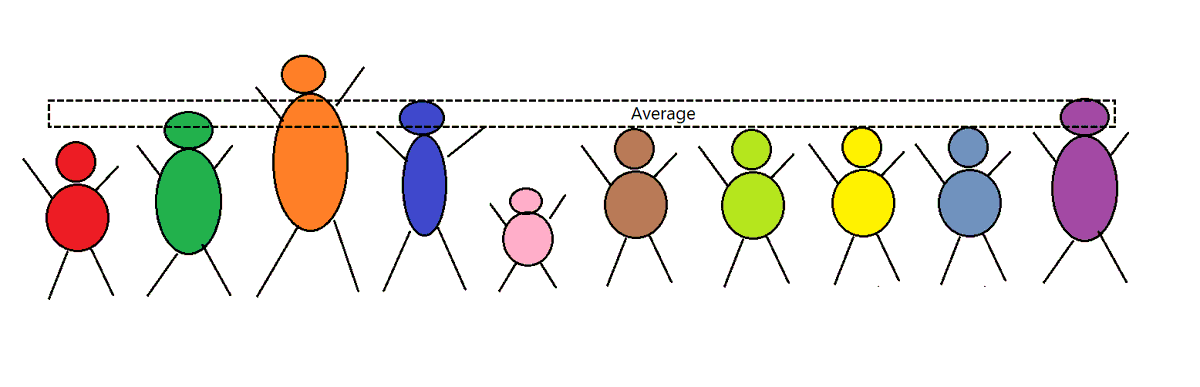
Imagine there are 10 people sitting in the room.
For example, their average height is 165 cm.
This is the average height and there can be a few people taller or shorter than the average height.
For example, their average height is 165 cm.
This is the average height and there can be a few people taller or shorter than the average height.
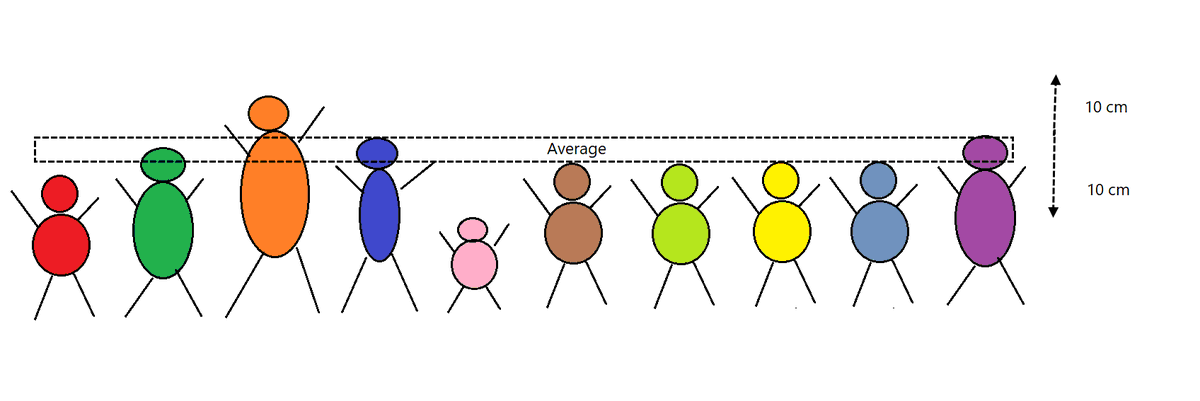
If I say that most people (roughly around 70%) will be covered in 10 cm band from the average number (10 cm above average & below average) Meaning, most people in the group r within 175 cm & 155 cm.
This is known as standard deviation (SD). 10 cm in this example is 1 SD.
This is known as standard deviation (SD). 10 cm in this example is 1 SD.
Understood the concept?
Statistically, around 68% of numbers are covered within one standard deviation from average. Around 95% is covered within the 2-standard deviation and 99% in the 3-standard deviation.
SD number would depend on the variation from average in the data.
Statistically, around 68% of numbers are covered within one standard deviation from average. Around 95% is covered within the 2-standard deviation and 99% in the 3-standard deviation.
SD number would depend on the variation from average in the data.
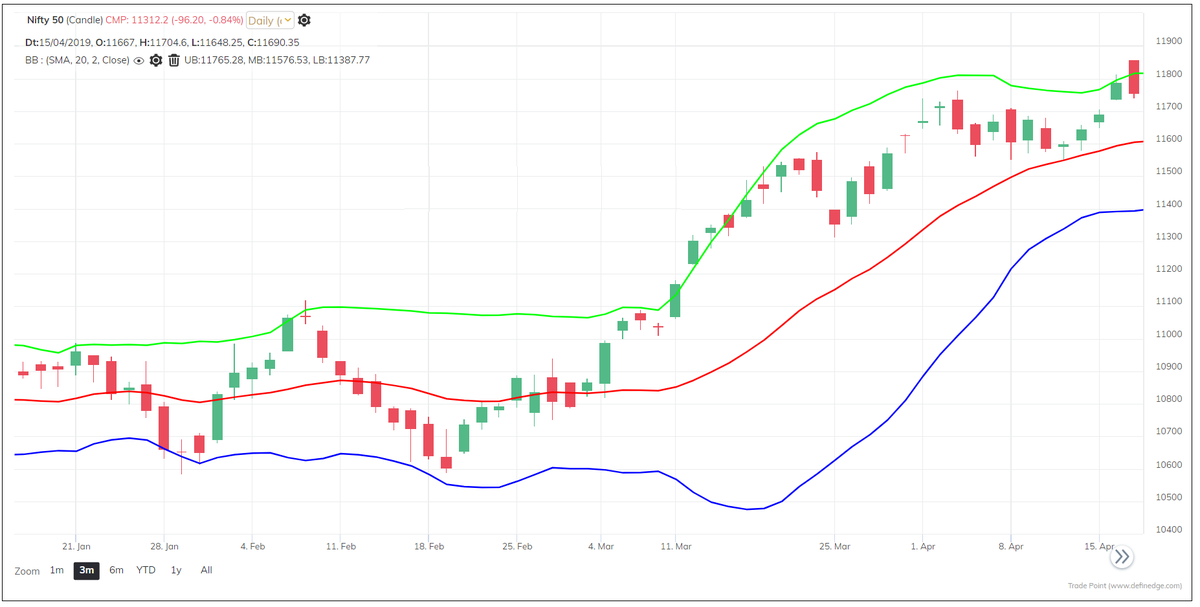
Same concept can be applied to price chart also.
We can calculate ave price (moving average) on price chart.
For example, average price of Nifty over last 20 bars is 11000. But there would be sessions with wide range, narrow rage etc during that period. We can calculate SD.
We can calculate ave price (moving average) on price chart.
For example, average price of Nifty over last 20 bars is 11000. But there would be sessions with wide range, narrow rage etc during that period. We can calculate SD.
Bollinger bands are calculated based on standard deviation.
Moving average is middle band. Add standard deviation to middle band to plot upper band and deduct it from moving average to plot lower band.
Moving average is middle band. Add standard deviation to middle band to plot upper band and deduct it from moving average to plot lower band.
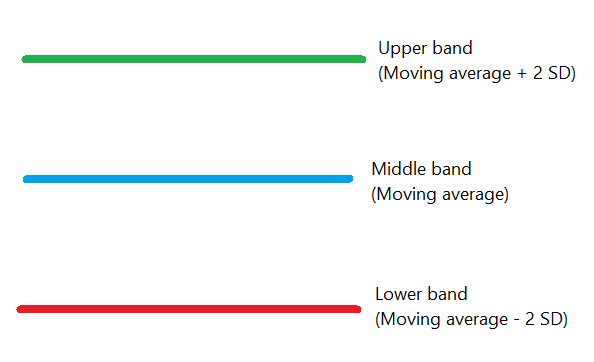
20, 2 is the popular parameter recommended by John Bollinger (average number of trading days in a month).
Meaning, 20-bar moving average and 2 standard deviation away bands from moving average, so it covers most of the data. Settings can be changed for experiment.
Meaning, 20-bar moving average and 2 standard deviation away bands from moving average, so it covers most of the data. Settings can be changed for experiment.
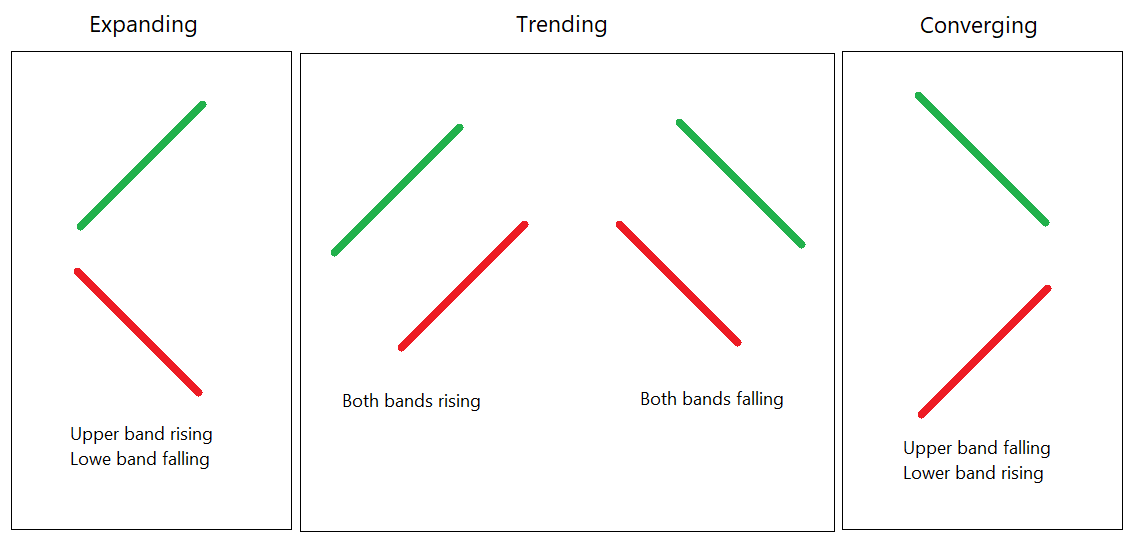
Shape of the band is determined based on two components: Moving average length and Standard deviation.
Moving average = trend
Standard deviation = volatility
Moving average = trend
Standard deviation = volatility
To put it in simple words,
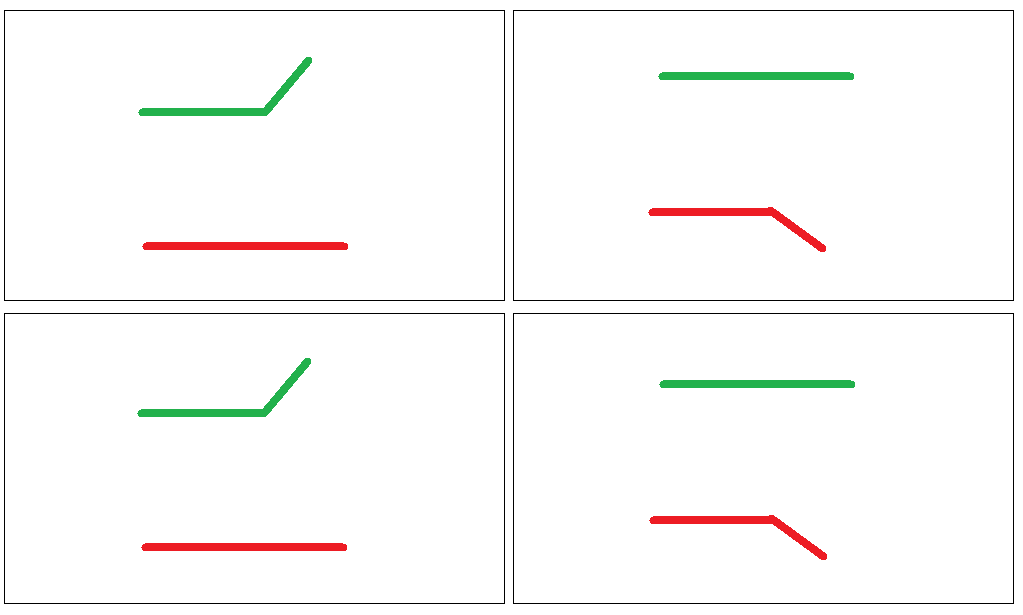
If Trend is stronger than volatility, bands will be trending.
If volatility is significantly reducing than the trend, bands will be converging.
If volatility is significantly increasing than the trend, bands will be expanding.
If Trend is stronger than volatility, bands will be trending.
If volatility is significantly reducing than the trend, bands will be converging.
If volatility is significantly increasing than the trend, bands will be expanding.
If volatility is higher- gap between upper and lower band will be higher. If volatility is low – gap between two bands will reduce.
If volatility is significantly low and two bands are in a very tight range, it is known as squeeze.
If volatility is significantly low and two bands are in a very tight range, it is known as squeeze.
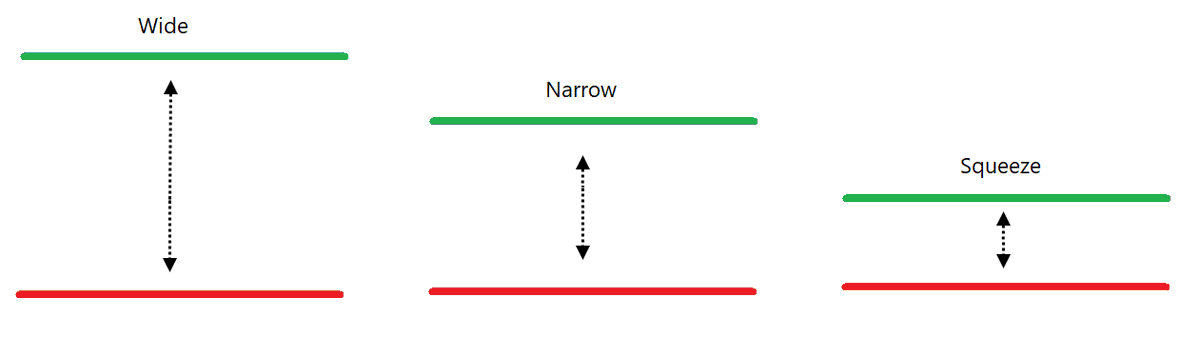
Bollinger says if gap between the bands are at a six month low, it is a squeeze.
Bandwidth indicator is derived from Bollinger bands. It is a particularly useful indicator for volatility. It calculates the distance between bands.
(Upper band - Lower Band) / Middle band
Bandwidth indicator is derived from Bollinger bands. It is a particularly useful indicator for volatility. It calculates the distance between bands.
(Upper band - Lower Band) / Middle band
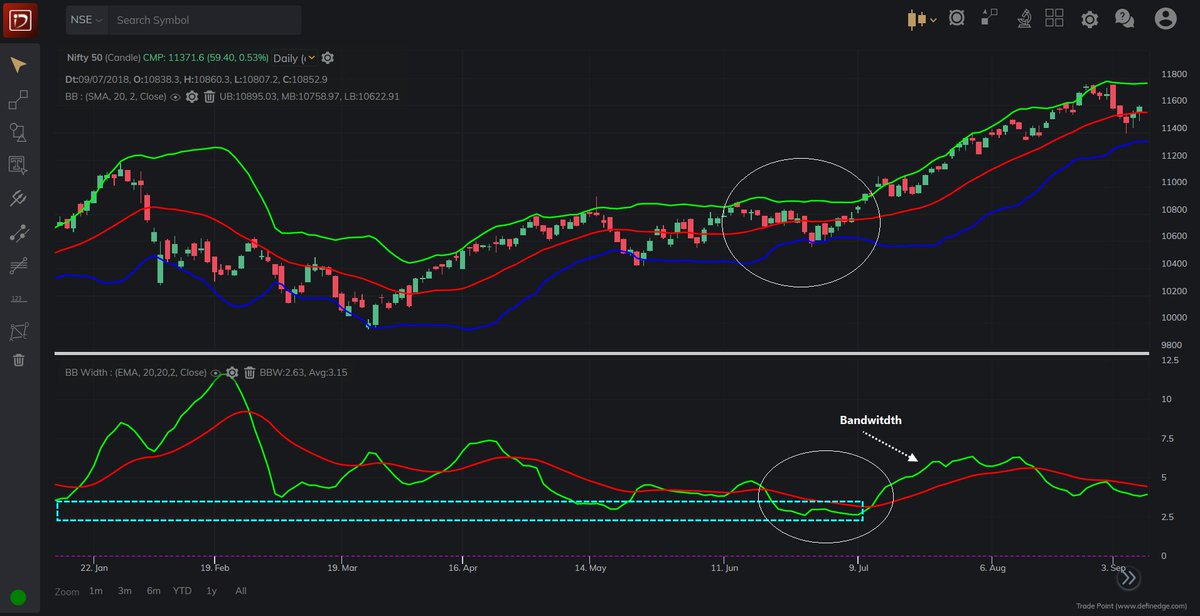
If Bandwidth is at six-month low – it is a squeeze. Higher the period, better it is.
Narrow range is expected to be followed by high volatility or trend (Volatility cycle). Extremely low volatility (Squeeze) is precursor to high volatility. Look for the breakout after a Squeeze.
Narrow range is expected to be followed by high volatility or trend (Volatility cycle). Extremely low volatility (Squeeze) is precursor to high volatility. Look for the breakout after a Squeeze.
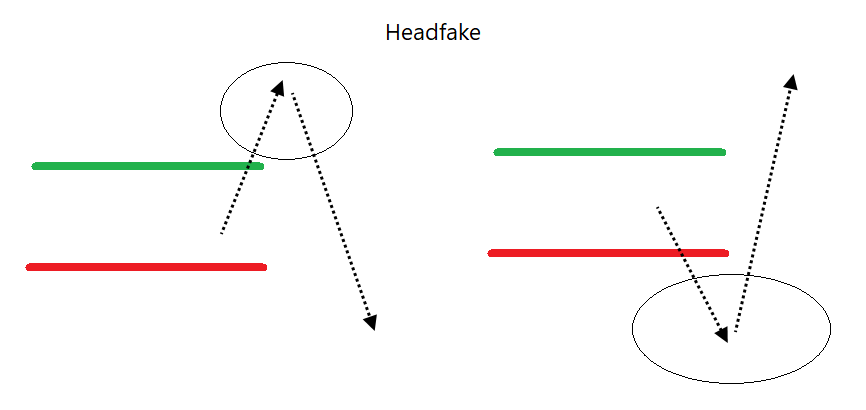
There is a concept called Headfake. Meaning, after a tight consolidation, price will give a short false breakout & then reverse. It may move in d opposite direction. So, beware & be prepared for that while dealing with squeeze. Change the direction if you realise it was Headfake.
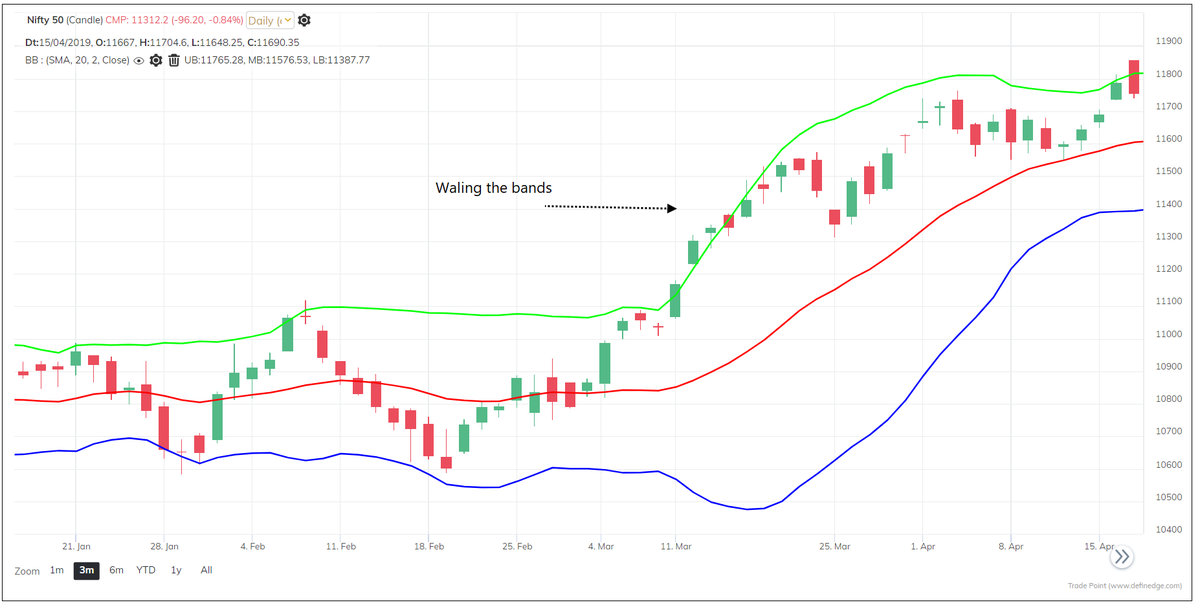
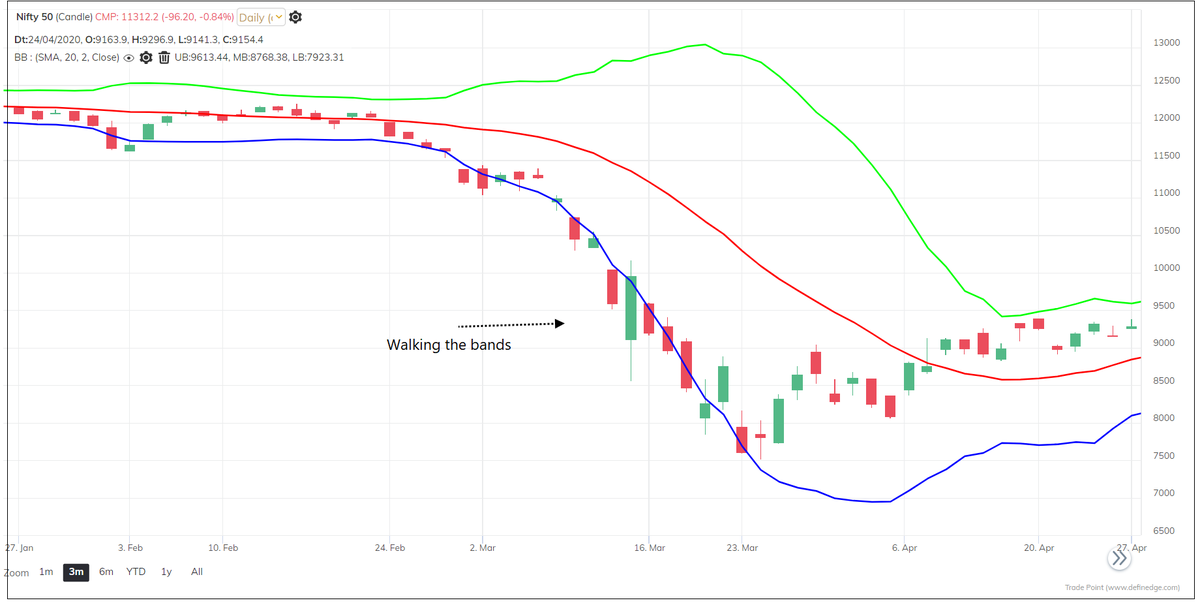
Should price reverse from the upper band and lower band? Mean reversion method can be applied at band extremes but it needs confirmation from other tools or indicators. It would be a mistake to simply call upper band as resistance and lower band as a support.
Rather, Price closing above upper band and below lower bands are continuation signals, not reversals – Bollinger calls it Walking the bands.
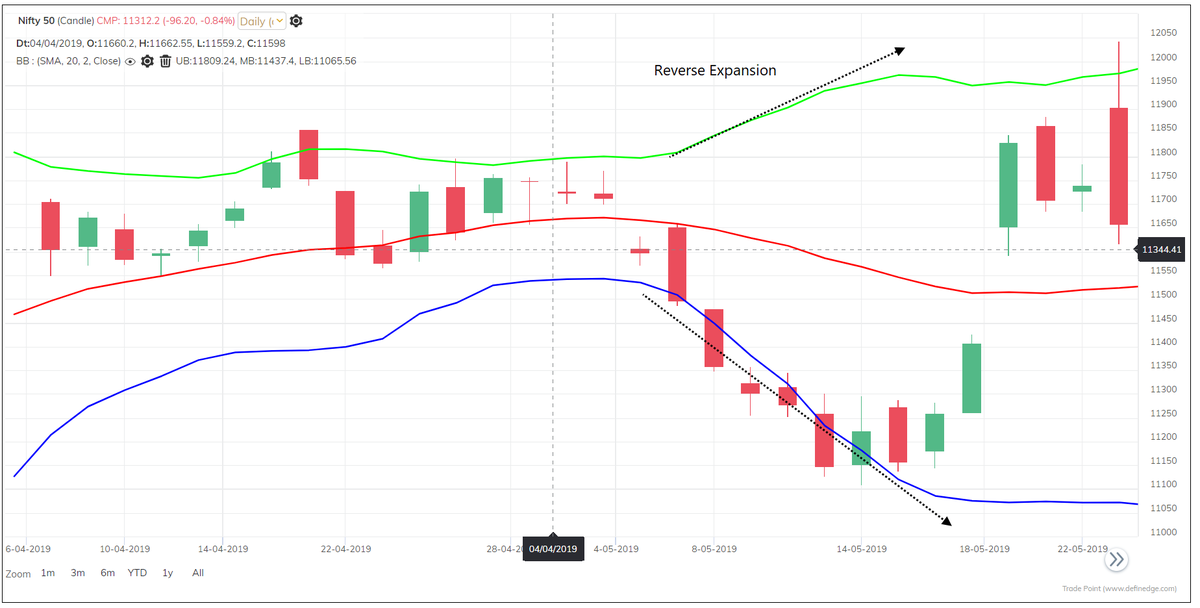
Falling LB & rising UB is known as Reverse expansion. It indicates temporary exhaustion & possibility of reversal or consolidation in near-term.
Remember, bands behave this way when volatility is significantly higher. Selling options would b a possible strategy (high premiums).
Remember, bands behave this way when volatility is significantly higher. Selling options would b a possible strategy (high premiums).
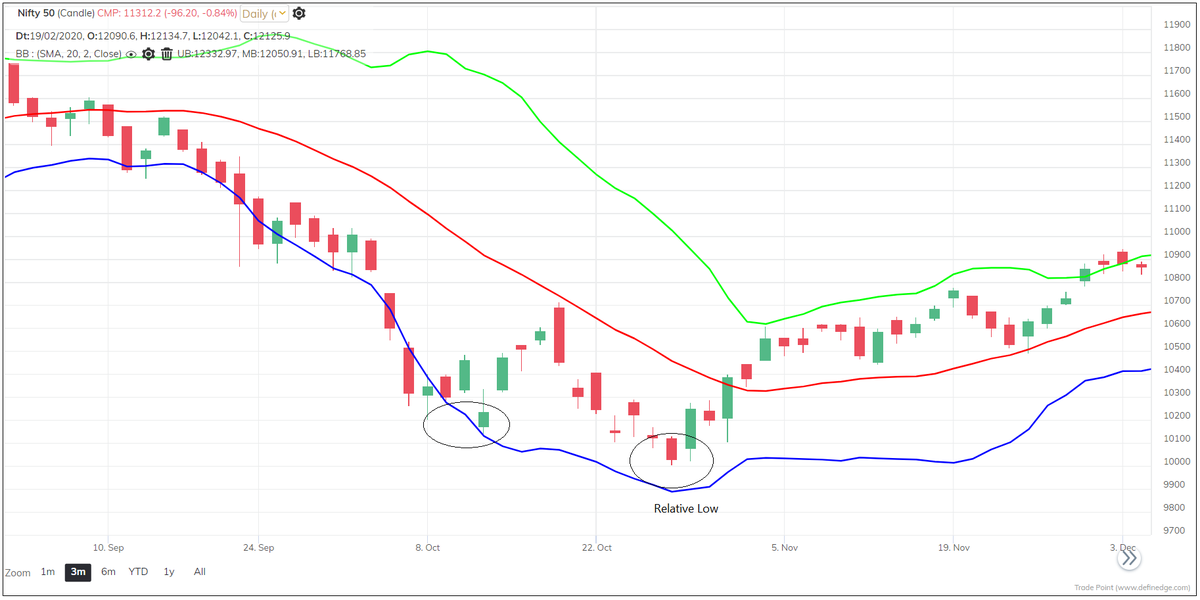
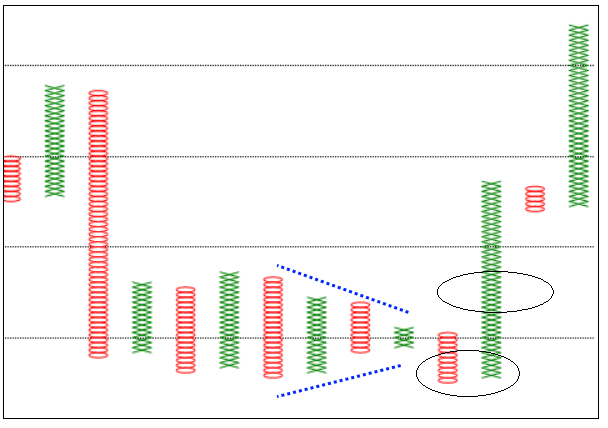
W and M patterns:
W (Relative low) = In downtrend, previous low is below the lower band and second low is above the lower band.
Second low is relative low even if second low is lower than previous low.
W (Relative low) = In downtrend, previous low is below the lower band and second low is above the lower band.
Second low is relative low even if second low is lower than previous low.
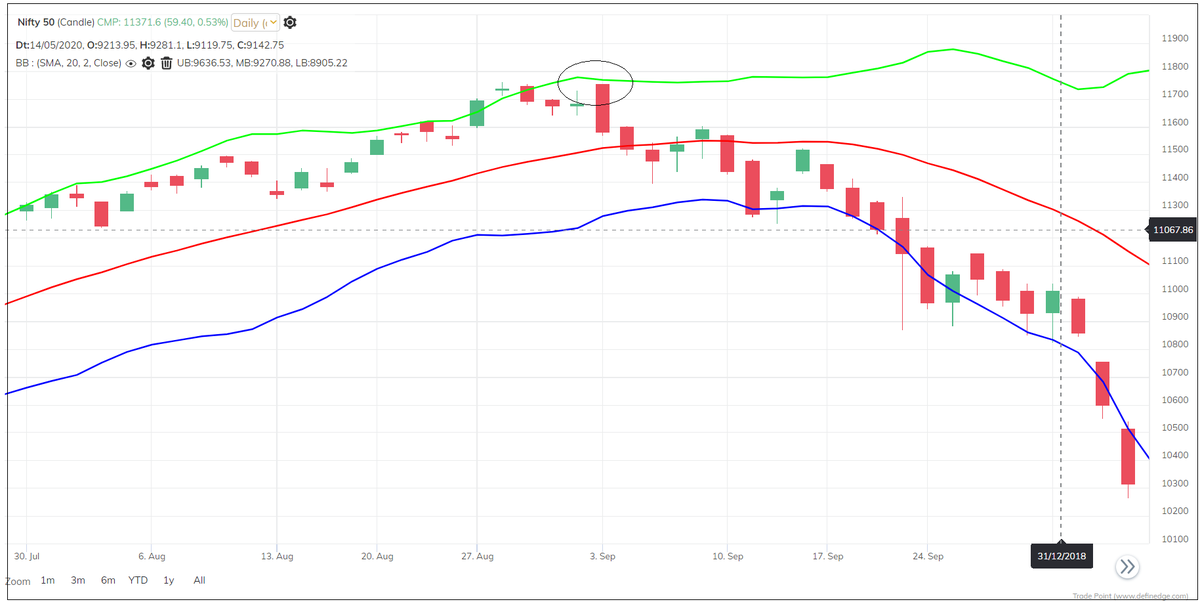
M (Relative High) = In uptrend, previous high is above upper band and second high is below upper band.
Second high is relative high even if second high is higher than previous high.
There can be multiple highs above upper band in uptrend.
Second high is relative high even if second high is higher than previous high.
There can be multiple highs above upper band in uptrend.
For walking the bands, reversal from bands, reverse expansion – a confirmation is required. It can be in the form of other indicators or volume analysis etc.
My pref would be a price pattern confirmation. It helps in planning the trades, placing the stops and managing the trades
My pref would be a price pattern confirmation. It helps in planning the trades, placing the stops and managing the trades
I also recommend Relative strength analysis along with walking the bands or Relative low, high analysis and Breadth analysis at reverse expansion or while applying mean-reversion techniques.
Remember, the Bollinger bands are calculated on closing price.
Remember, the Bollinger bands are calculated on closing price.
For more understanding of Bollinger bands and to know more about it - The book by master himself – ‘Bollinger on Bollinger bands’ is strongly recommended. It is amazingly a beautifully written book.
The concept of Headfake helped me while dealing with triangles in P&F charts. Multi-column triangles are pattern of tight consolidation – Headfake from it can result in failure of breakout after that. It helped me treating triangle failure as a separate pattern.
Point is, how understanding the concepts can help you in many ways. We can’t use all indicators bt we can learn the principles which will help us in the long run. Don’t fall in the trap of looking for best indicator, there is none. Logical understanding makes all of them useful.
Using indicators not grounded firmly in practical considerations and not fully understood will result in insufficient confidence to execute the system when the times get rough, or, for that matter, when the times get too good! – John Bollinger.
<End of thread>
<End of thread>