Thread: Donchian Channels
Donchian channels were invented by Richard Donchian. He is known as a father of trend following trading. He was founder of world’s first managed fund in 1949.
#donchianchannels #indicators #definedge
Donchian channels were invented by Richard Donchian. He is known as a father of trend following trading. He was founder of world’s first managed fund in 1949.
#donchianchannels #indicators #definedge
Donchian was born in 1905, he got interested in trading after learning abt story of Jesse Livermore. Donchian started relatively at young age but wasn’t successful initially in the market. He lost significant money in 1929 crash. Bt managed to come back & started practicing again
He was a self-taught chartist and technician. He created strategies using charts and indicators and also studied company’s underlying fundamental characteristics. He also wrote technical newsletters for over two decades for well-known firms.
Donchian was popular and doing good but he was not managing significant size even after being 42 years in the business. He saw great success in his trading and fund management business during his mid- 60’s and continued to achieve new heights. He was trading in his 80’s too.
He is considered to be the creator of the managed futures industry. Publicly held Fund with an idea of diversification was new in 1949. He developed a system-based approach for trading and many concepts which we are being used even today.
Donchian focused on developing rule-based & systematic approach to trading the markets. He taught many students who went on to become successful traders & money managers. In fact, many traders, or analysts whom we study even today were influenced by his work & studied it further.
Donchian used 4-week breakout trading system. Inspired by him, Richard Dennis used 20-day breakout rule for Turtle trading system. Of course, there are many other rules in Turtle system which we discussed in the earlier thread. Donchian also worked on moving ave crossover systems
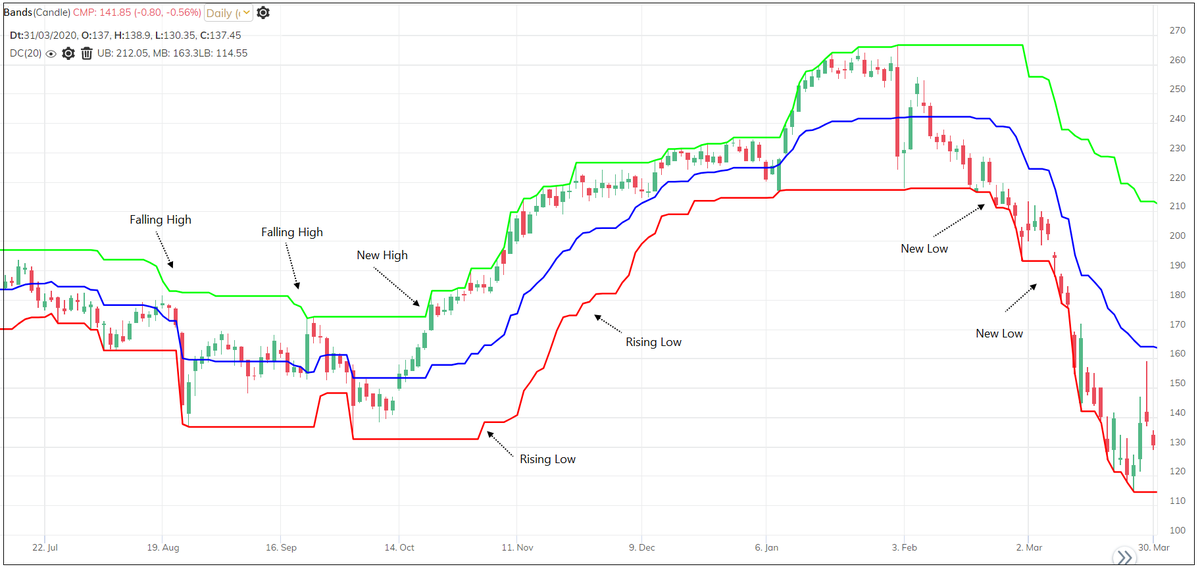
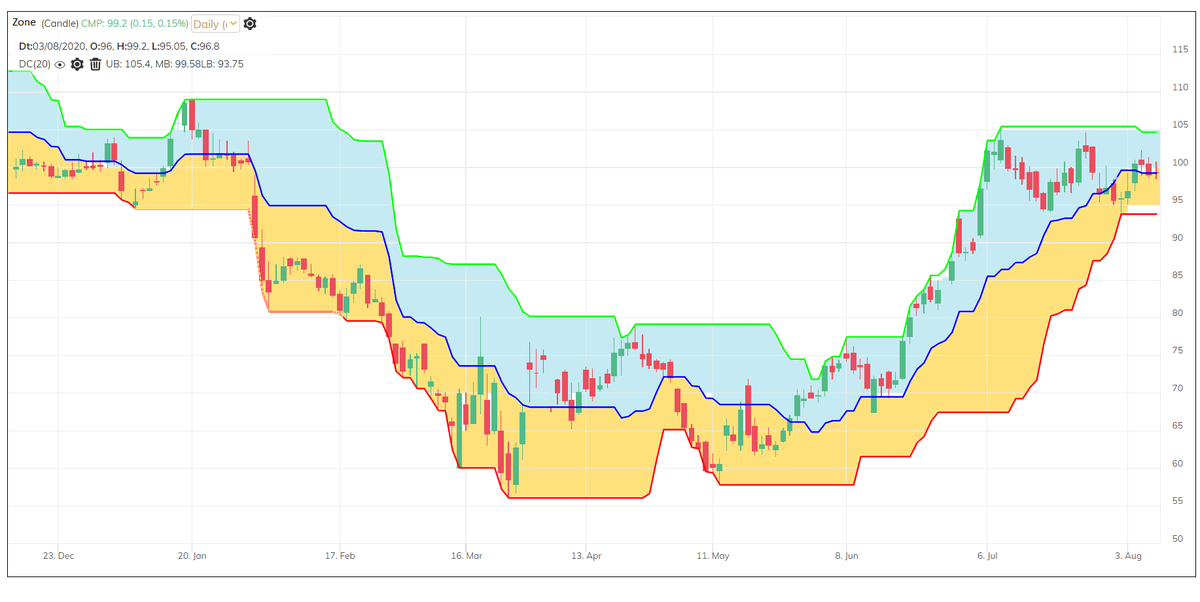
You will see three lines on the chart when you will plot Donchian indicator on the chart. Upper band (UB), middle band (MB), and lower band (LB). Default parameter is 20.
>Highest high of last 20 bars is UB
>Lowest low of last 20 bars is LB
>Average of both is MB (UB + LB) / 2
>Highest high of last 20 bars is UB
>Lowest low of last 20 bars is LB
>Average of both is MB (UB + LB) / 2
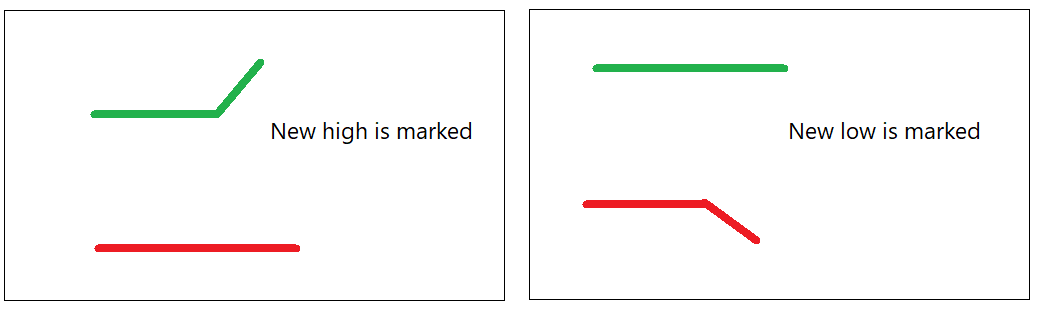
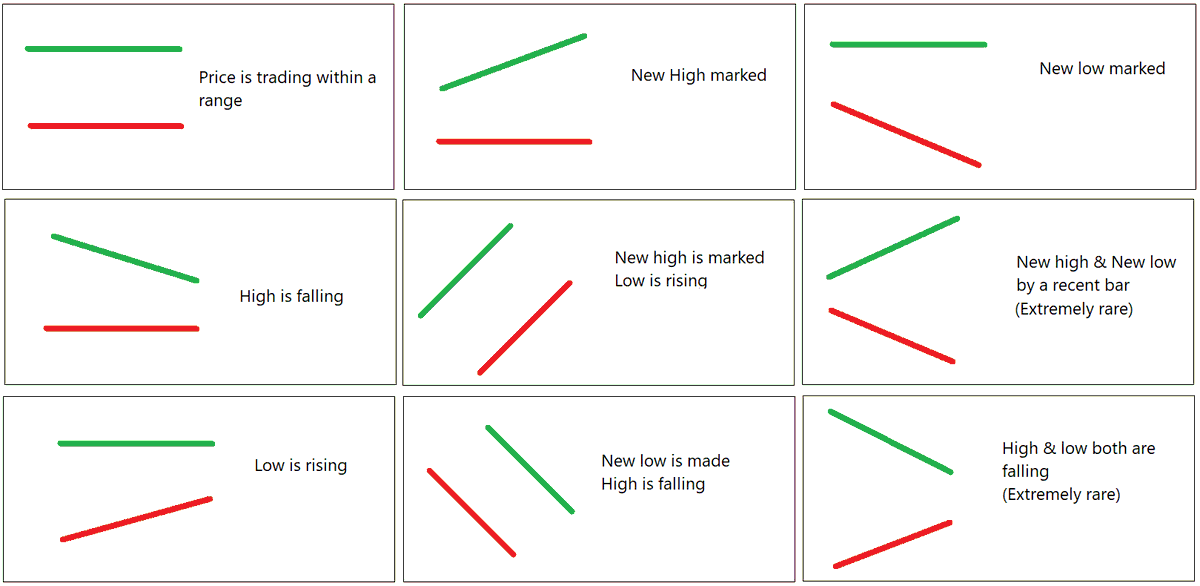
So, if today’s high is new 20-day high, you will see upper band rising.
If today’s low is new 20-day low, you will see lower band is falling.
If today’s low is new 20-day low, you will see lower band is falling.
Simple? You know the indicator well now, right?
So think before reading further...
what does it mean when you see lower band rising?
That means the lowest low was first bar in last 20 and that bar is dropped from the calculation now. In simple words, range is changed.
So think before reading further...
what does it mean when you see lower band rising?
That means the lowest low was first bar in last 20 and that bar is dropped from the calculation now. In simple words, range is changed.
There is a new 20-day low which is higher than the previous low. So, easy to understand what it means when we see upper band falling.
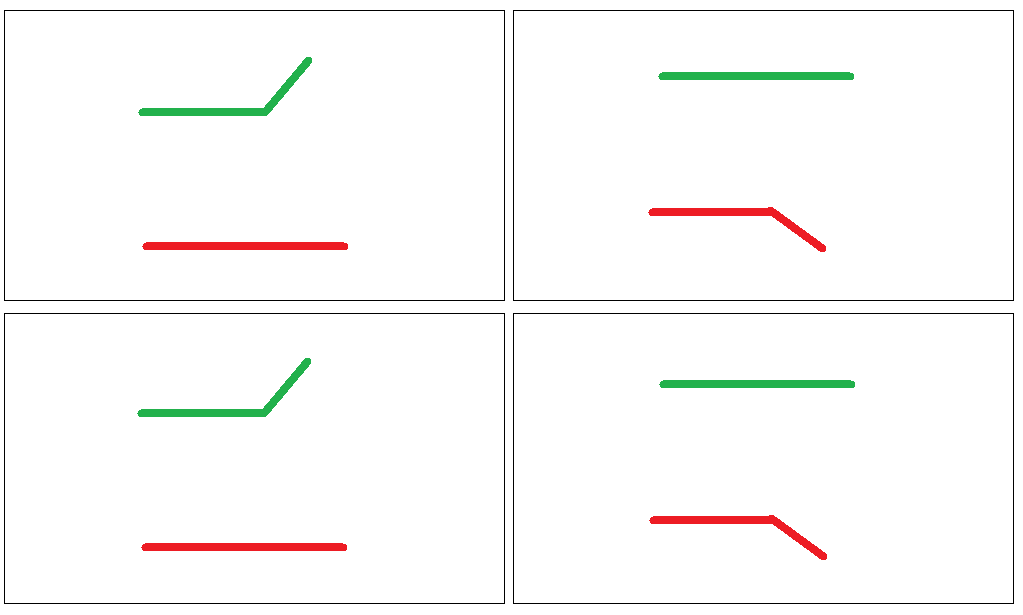
So, on a given bar - there are below mentioned possibilities for both the bands:
So, on a given bar - there are below mentioned possibilities for both the bands:
So this way, state of the market can be decided based on the positioning of Donchian bands. How if we define & score them:
Rising UB = Bullish (2)
Falling LB = Bearish (-2)
Falling UB = Semi-Bearish (1)
Rising LB = Semi-Bearish (-1)
Flat UB = Neutral (0)
Flat LB = Neutral (0)
Rising UB = Bullish (2)
Falling LB = Bearish (-2)
Falling UB = Semi-Bearish (1)
Rising LB = Semi-Bearish (-1)
Flat UB = Neutral (0)
Flat LB = Neutral (0)
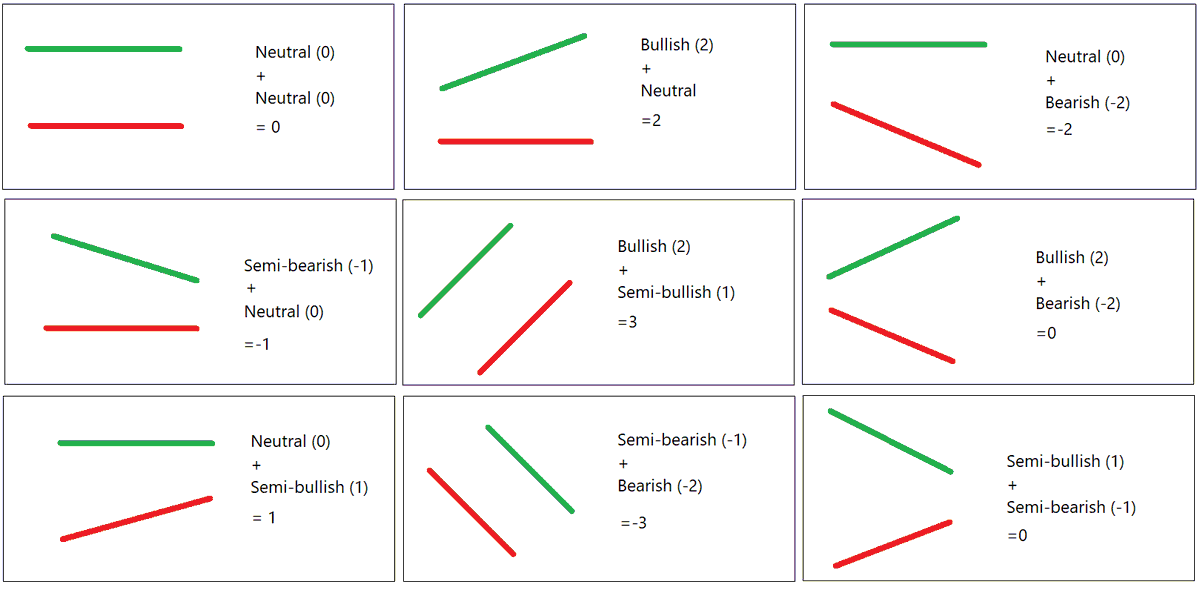
When a greater number of stocks in the group r having score 0 – it is a range bound market. When a greater number of stocks have a bullish score – it is a bullish market, trust breakouts. This can be calculated on multiple periods to gauge the strength of trend on them.
Let us discuss the indicator further.
Remember, After going below lower band if price goes above upper band, it is a fresh bullish breakout. Otherwise, it is a continuation bullish breakout. Vice versa for bearish breakout.
Remember, After going below lower band if price goes above upper band, it is a fresh bullish breakout. Otherwise, it is a continuation bullish breakout. Vice versa for bearish breakout.
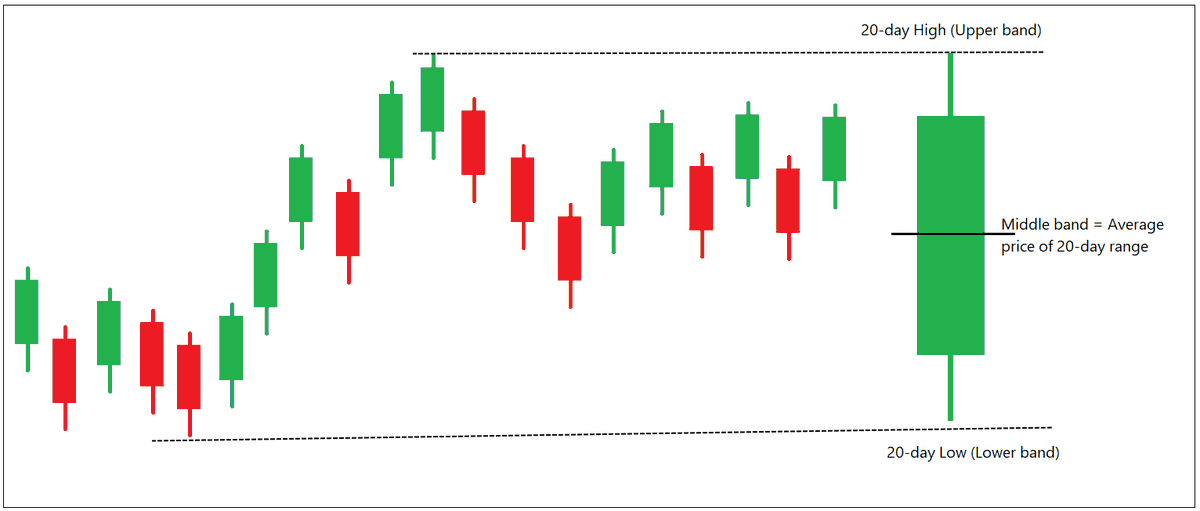
What is Middle band?
If I combine all 20 candles & make one: High of that candle is highest high of 20-candles (UB) & low is lowest low of 20-candles (LB). Ave price of this candle is MB.
When MB rises, that means ave price of last 20-candles is rising & vice versa
If I combine all 20 candles & make one: High of that candle is highest high of 20-candles (UB) & low is lowest low of 20-candles (LB). Ave price of this candle is MB.
When MB rises, that means ave price of last 20-candles is rising & vice versa
Middle band is a logical indicator as well. Roughly, 20-day momentum indicators would be above mid-value when price is above Donchian middle band & vice versa.
To keep it simple,
Price > MB = Bullish zone
Price < MB = Bearish zone
To keep it simple,
Price > MB = Bullish zone
Price < MB = Bearish zone
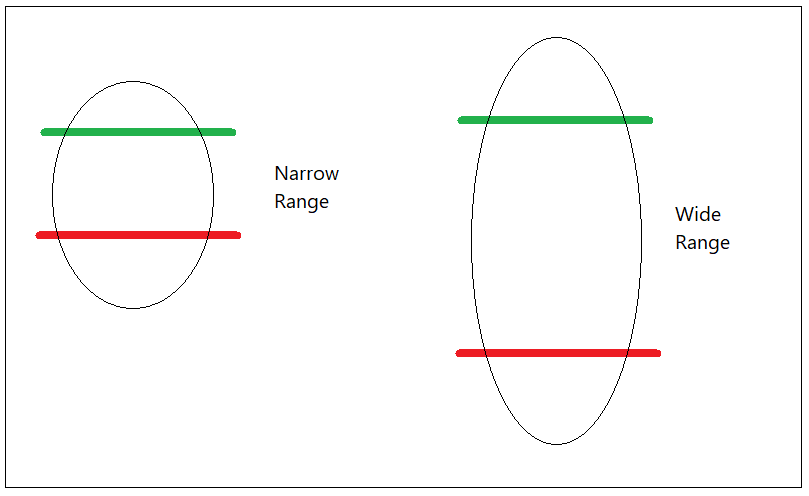
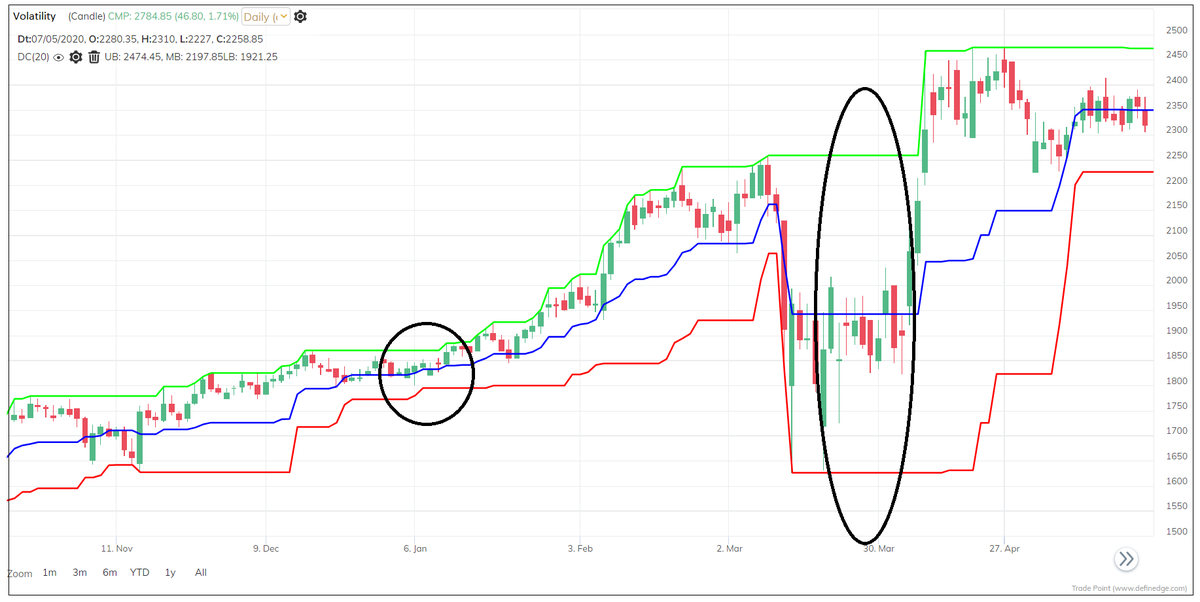
Distance bw upper & lower Donchian bands tell us about volatility as well. When distance is higher, market is volatile. When distance is not much – market is in narrow range. We can calculate Donchian bandwith indicator – more about that later, thread will be too long otherwise.
So, you can plot Donchian band whenever you need high or low of last certain period in your system. There are many types of rules possible using Donchian bands.
SAR: Trade upper band and lower band breakouts – it becomes SAR (Stop and reverse) method in that case.
SAR: Trade upper band and lower band breakouts – it becomes SAR (Stop and reverse) method in that case.
Trend: Middle band can be used as a stop-loss for upper band and lower band breakouts.
Price: You can also combine it with price patterns. Look for bullish price patterns in bullish zone, and bearish price patterns in bearish zone.
Price: You can also combine it with price patterns. Look for bullish price patterns in bullish zone, and bearish price patterns in bearish zone.
Pullback: Bullish pattern near middle band during retracement after crossing upper band is a bullish pullback setup.
You can combine it with other indicators as well – but I want to talk more on how to user combination of indicators. It is a remarkably interesting subject.
You can combine it with other indicators as well – but I want to talk more on how to user combination of indicators. It is a remarkably interesting subject.
20-day is a default parameter and used in this writeup - Do experiment with it.
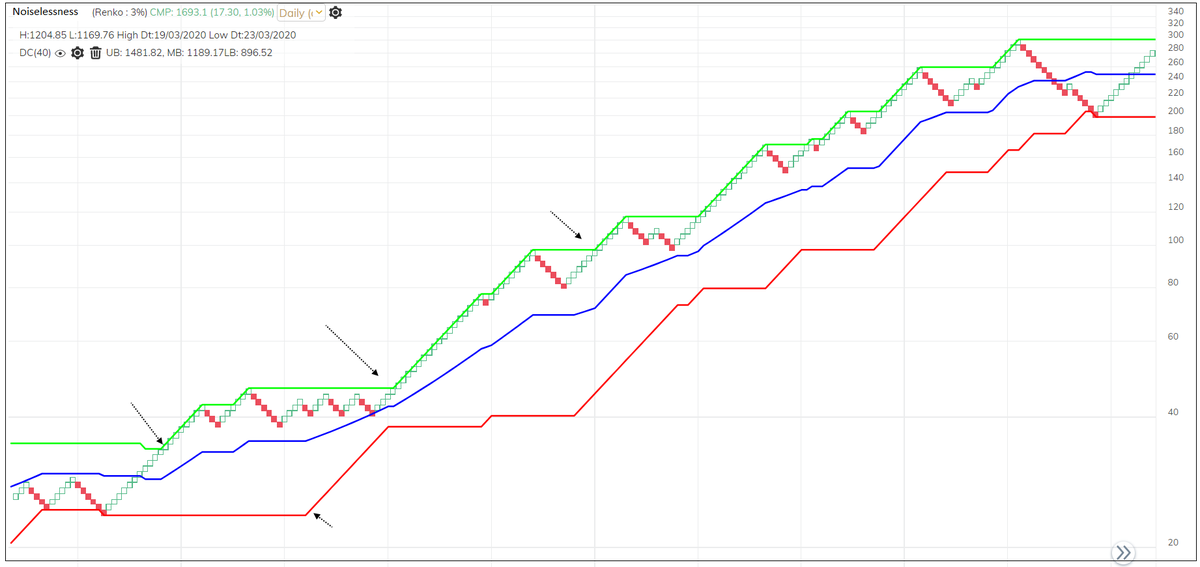
I plot Donchian channel on Noiseless charts – it’s a very useful concept they show range breakout minus time bars.
There some trading guidelines by Donchian, I will write separately on them.
I plot Donchian channel on Noiseless charts – it’s a very useful concept they show range breakout minus time bars.
There some trading guidelines by Donchian, I will write separately on them.
The thread gave me opportunity to talk about Richard Donchian’s inspirational journey. Lost heavily initially, fought back, learned from mistakes, developed own approach that is helping generations. Contributed through reports, writeups, found first managed futures fund –
- developed systematic trading, trend-following approach, taught many who became successful in the field. Found meaningful success after working for around 42 years in the field & in his 60's. His contribution to Technical analysis & trading will always be remembered. <End>
• • •
Missing some Tweet in this thread? You can try to
force a refresh