My Authors
Read all threads
Good lord, what a happy day! My cup o'erfloweth!

1. Valentina and Eike's updated paper has arrived on the journal website.

2. As I show below, the Big 10 (who I am guessing from twitter comments are some sort of sports governing body) should now be reopening their sport.
As you recall, the reason for my original mischievous tweet all those weeks ago, was to make fun of my friends for a cockup in their abstract.

The main statistic in the abstract was of course impossible.

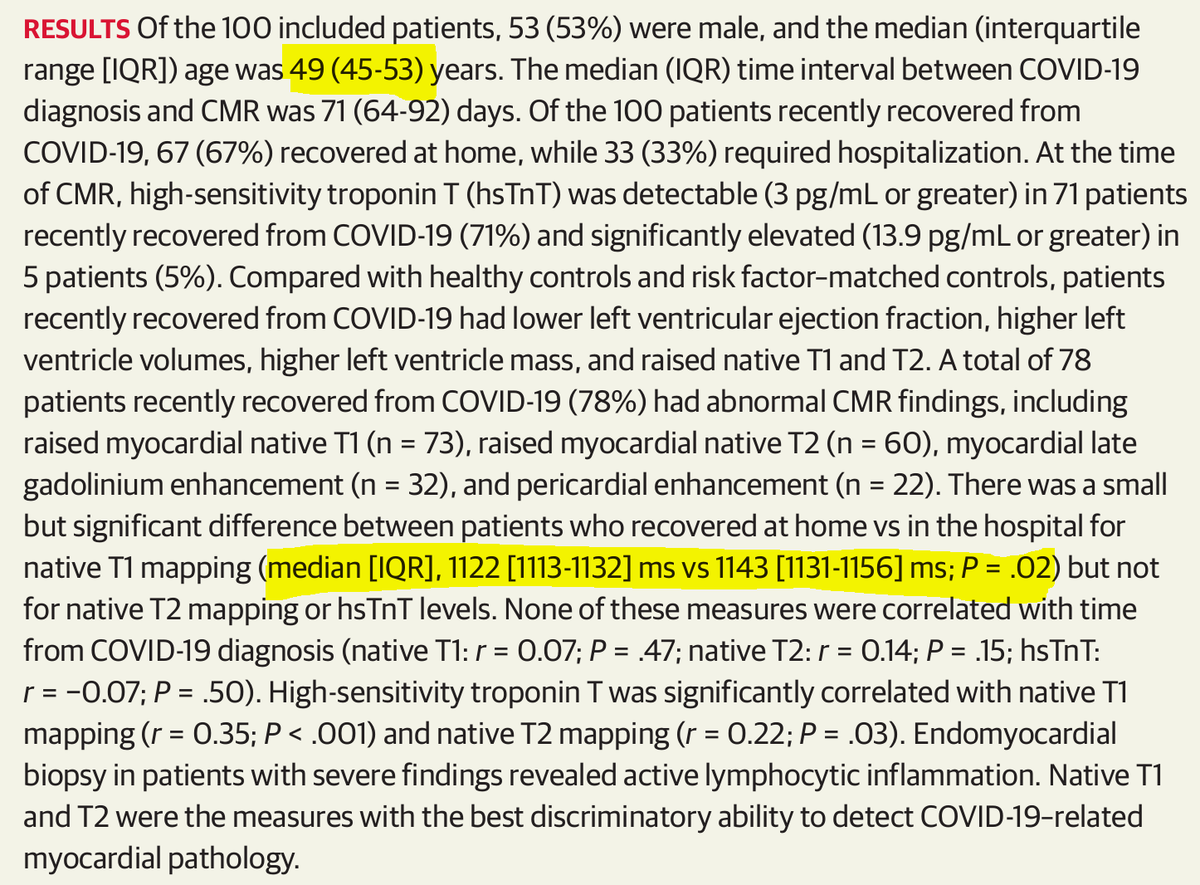
OLD VERSION:
I normally deal with ORBITA-HQ'ers so I was expecting everyone to join in the laughter when I tweeted it (without the highlighting) because the local crowd here would instantly recognise that those IQRs could not possibly give a P value of 0.02

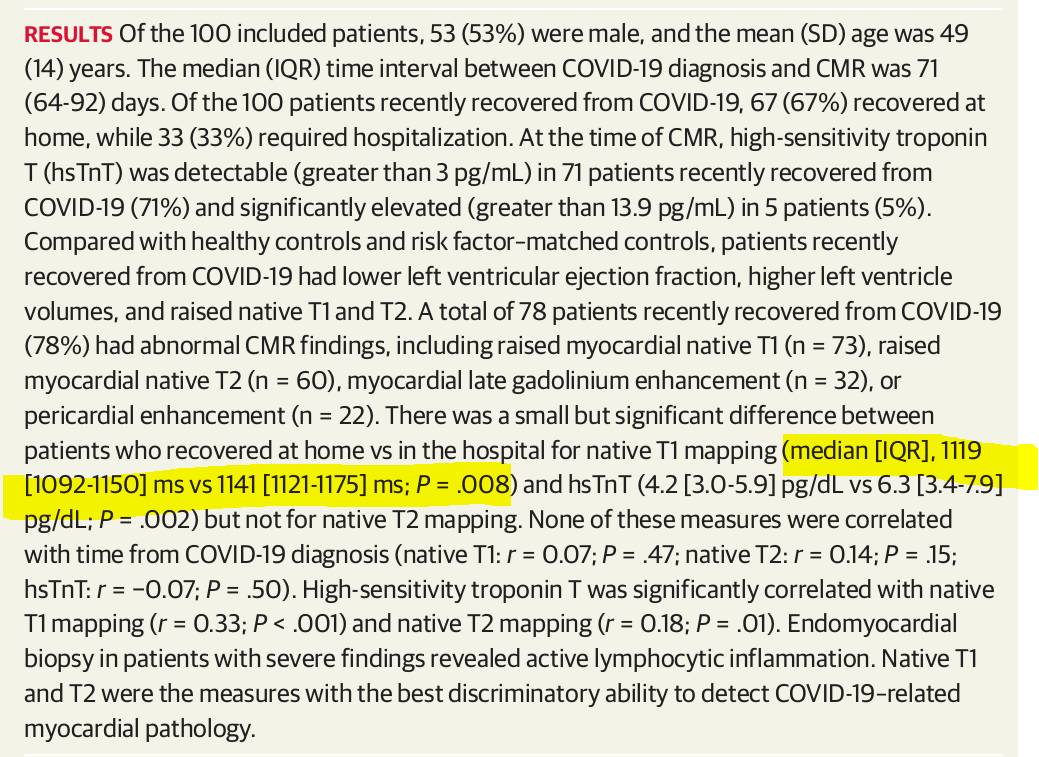
Have a look at the revised version
It is obvious that the original numbers did not match (for reasons I previously explained), and AT LEAST ONE of the seven numbers was wrong and would have to change.

How many, in fact, turned out to be wrong and had to be changed?
The ONLY point I was trying to make with my original tweet was that any Cardiology Fellows should be able to spot that "these 7 numbers can't all be right together".

I was disappointed that the first half a million downloaders didn't notice it.
I didn't know that all 7 numbers were mistakes.

My principle is as follows:
"When one thing is obviously incorrect,
Don't assume that the others are OK."

Peter Falk
Archives Columbo, 1975
And to the people who mocked me saying "How do you know this was not true" regarding the age stuff:
To them I say this.

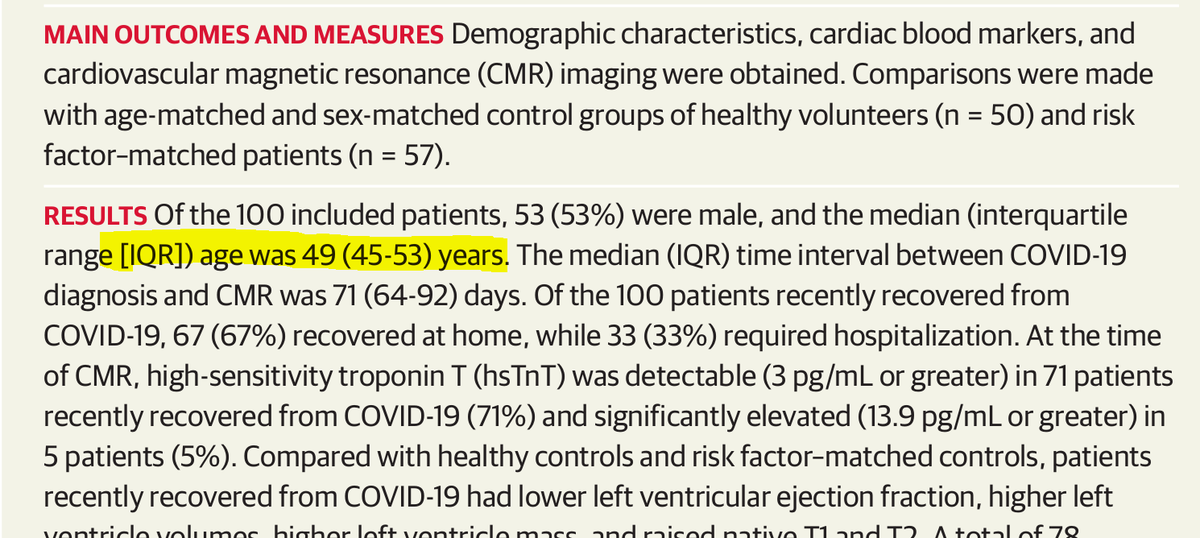
The interquartile range of age in that old version above was
That is obviously too narrow, for a group of people not selected specifically for age.

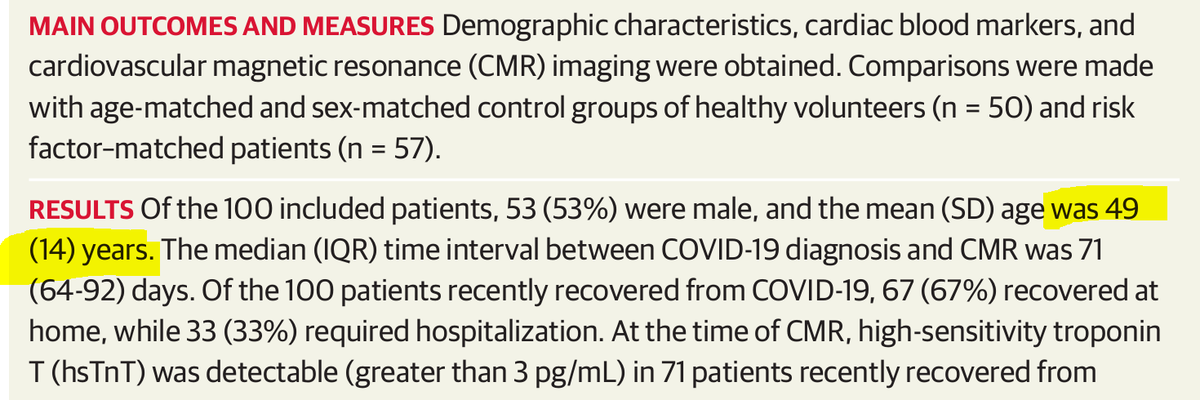
In the updated version, here is the age distribution.
In a Normal distribution which, roughly speaking, the age follows, the IQR is about 4/3 of the SD.

So *now* what is the IQR of age?
That is
So to the people who said words to the effect that "I have no idea about the stats but I am somehow confident to say they are very impressive", I suggest they revise their approach to drawing conclusions.
Cardiology fellows need these skills (in my dept) because I give them a remorseless mocking if they come into my office with mistakes like that.

And of course they mock me, when I make such mistakes, which I do frequently.
(But only while I am laughing with them, obviously.

Once I stop laughing, it's all over, they have to keep a straight face and pretend nothing ever happened.)
Now let's have a look at Table 1 which was the next thing that caught my eye, when the Twitterverse disappointed me by not noticing anything for 12 hours in the abstract (or rather, talking about lots of more subtle and erudite matters of MRI which I could not understand).

OLD:
NEW:
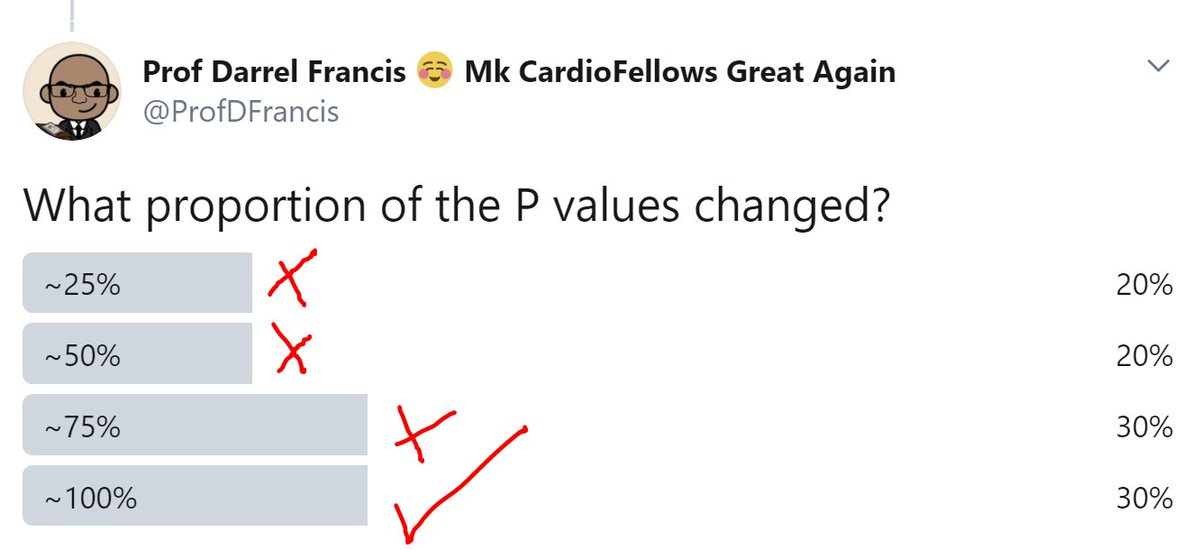
What proportion of the P values changed?
Remember I highlighted the IQRs of age, systolic, diastolic and heart rate? And said those could not possibly be IQRs?

They weren't.

What were they?
Incidentally this is how the paper got published the first time.

Most people are very unobservant.
First person wrong on "what was this".

OBVIOUSLY it wasn't mean +/- SD!

Think about it, people!!!

NEW:
SD is what?

Hint. It is highlighted in yellow. (Doh)
So +/- SD would be how wide?
Nor can it be +/- 2 SD, as that would be 64 (mmHg) wide.

How wide was the originally quoted range?
How wide was the gap between those highlighted numbers?
So we can immediately discount +/-SD (which would give a gap of 32) and +/- 1.96SD (which would give a gap of 64)

Yes?

The option I provided was completely laughable - it *cannot* be +/- anything to do with SDs.
So it must be something to do with SE's.

If the SD in a sample of 100 patients is 16, roughly what is the SE?
No you don't need a calculator!

The SE (which is a measure of how much the sample mean wiggles around when you have lots of patients rather than just one)

... declines in proportion to square root of N.
Valentina and Eike have gone to considerable effort to recruit a number of people that is a SQUARE of a ROUND number.

Don't disrespect that.

N = 100.

SQRT(N) = 10

Therefore since the SD is 16, the SE must be 1.6.
Plus minus 1 SE would be how wide?
Yup. Too narrow.

So, by exclusion, it must have been +/- 1.96 SEs, i.e. the confidence interval of the mean.

How wide would that be?

Hint: twice as much as the answer above.
The originally published gap was 8.

The gap size you calculated just now for the +/- 95% SE, i.e. the 95% Confidence Limits of the mean, was 6.4 (sorry I typed 6.3 instead by mistake).

Does this fit?
Yes it does, you nasty people!

The "8" was calculated from two numbers rounded to the nearest integer. Each number contains a rounding of up to 0.5.

Therefore the combined effect of the rounding can be as much as +/1. The "8" is therefore somewhere between 7 and 9.
Likewise the "16" SD is somewhere between 15.5 and 16.5.

Let's take the upper end of this, to help meet the new numbers.

16.5 /sqrt(100) = 1.65.
2 x 1.96 lots of that is 6.47.

That doesn't work because it is inconsistent with the smallest value of our "8", which is 7.
*BUT* we have taken 1.96 SE's.

Suppose we took 2 SE's, in haste?

Now 2 x 2 x 1.65 = 6.6
That rounds to 7.

And the "8" could be as small as 7.

So does it fit now?
No, it doesn't fit.

I tricked you by saying there was another level of rounding which in reality we are not entitled to.

We have already used all the rounding available to us.
So what we know is that the original IQRs were:

Not IQRs
Not ± SD
Not ± SE
Not ± 1.96 SD
Not ± 1.96 SE
Not ± 2 SD
Not ± 2 SE

What they were, is still a mystery.
Am open to persuasion!
Now for the good news.

Football is reopening, and here is why.

The reason to close football was as follows:
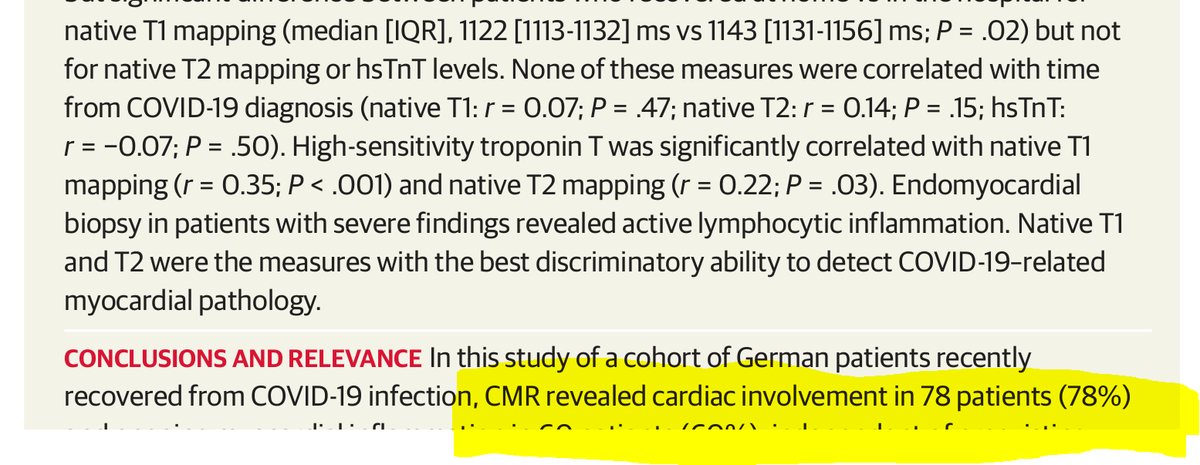
78% who recovered from COVID have some MRI stuffs in their heart.

Scary?
Well, it depends on what the rate of those scary MRI stuffs is in NON COVID people, who are otherwise similar, doesn't it?

Which is the relevant control group?
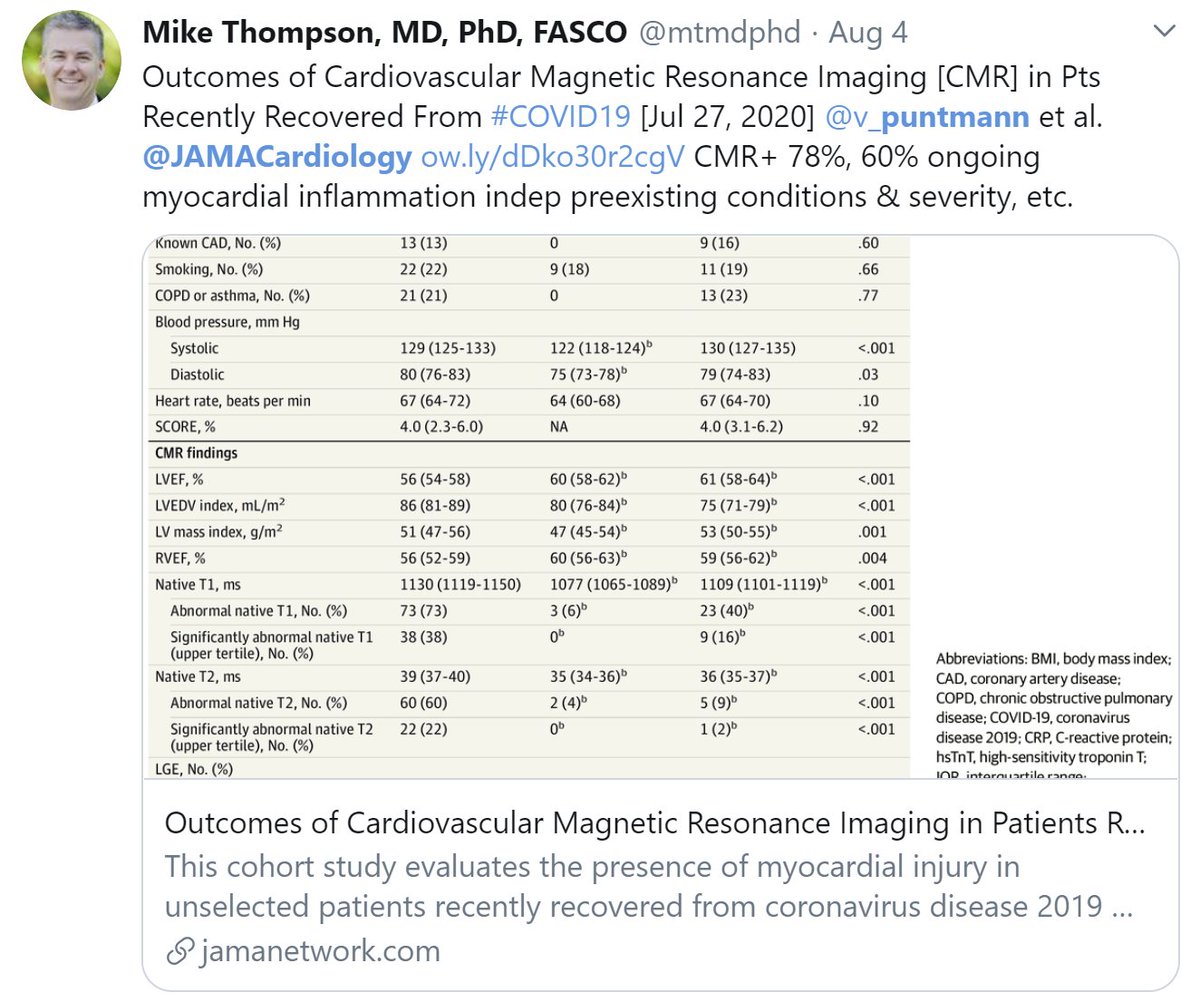
Here is the crux of the paper:

Three groups of people.

First column, Covid survivors.
Second column, healthiest people in the world
Third column, People resembling the Covid'ers, but who hadn't have Covid
For some reason, the journal forced them to present the P value comparing all 3 columns, instead of just comparing the Covid'ers with their risk-factor-matched controls.

This is a shame, because it makes the published P values useless to us.
Never mind, at least Valentina and Elke could sneak out the actual data, and that's all we need to calculate the p value that we care about.

OLD:
NEW:
In the healthy controls, what has happened to the number with abnormal T1?
And in the risk-factor-matched controls, what has happened to the number with abnormal T1?
So this was a thorough reworking of the raw data.

It turns out that it is far from obvious whether a person has abnormal T1 or not.

This is something my MRI colleagues pointed out to me, and went over my head, as I have no idea about MRI.
Anyway, the key point is, DO NOT PANIC.

Whether an MRI is abnormal or not, is very difficult to decide, and people change their minds all the time, as happened here.

And now, what we have all been waiting for.

DOES COVID GIVE YOU T1-ism?
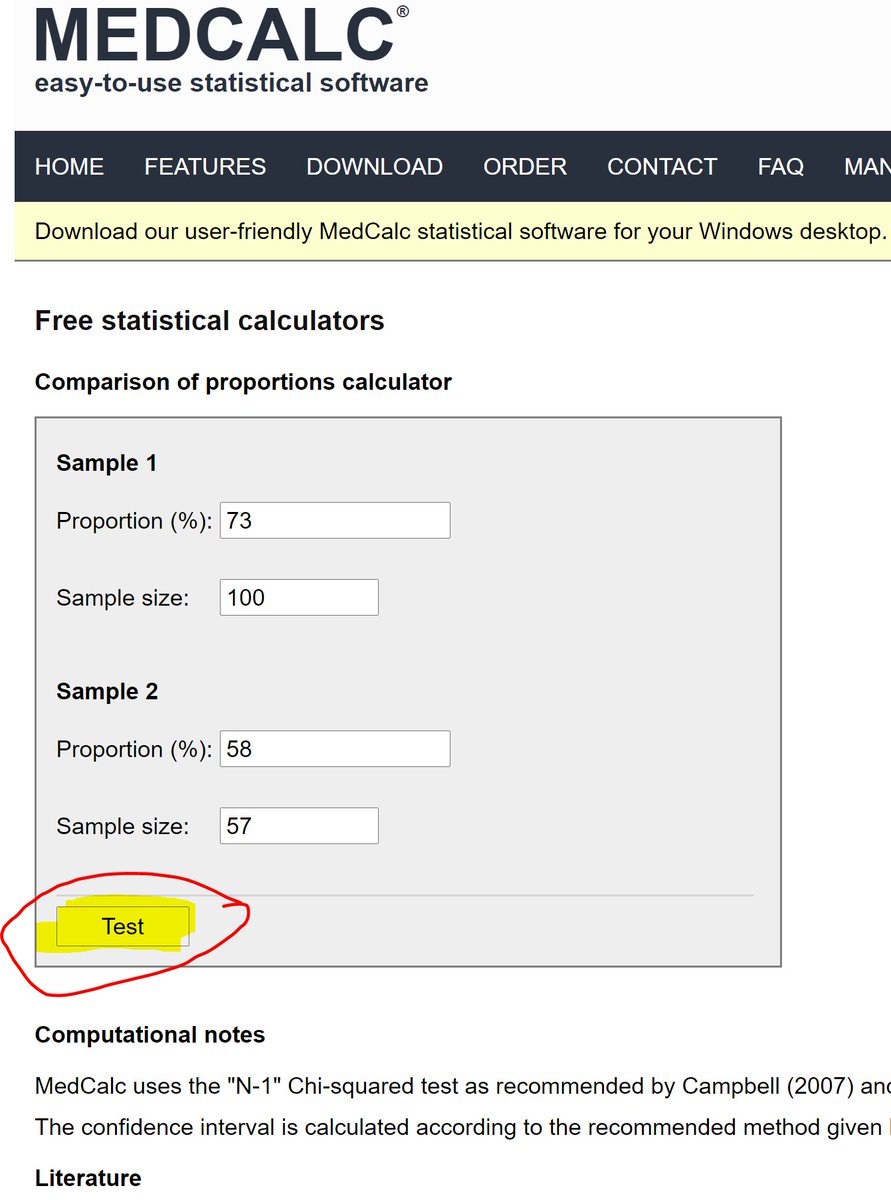
73% of 100 Coviders had the abnormal T1 thingy

58% of 57 non-Coviders (with similar risk factors) had it

Drum roll please ....

Let's google for "comparison of proportions online"

We get this.
medcalc.org/calc/compariso…
Go and calculate it for yourself, you just have to type the 4 numbers and press the button.
And then you will see, that the Football will be reopening.

Covid survivors DO have thingies in their T1.
But it is JUST AS COMMON in people with similar risk factors who have NOT had Covid.
In other words, yes there are those funny thingies in the scan,

But it is NOTHING TO DO WITH HAVING HAD COVID.

It is because of the background risk factors.

On that note, I am off for a short run. (Well, more of an amble, but anything to stop be becoming one of those controls)
I expect the Big 10 chappies will be announcing the reopening later today, when they realise that it is LACK OF EXERCISE, not the having of Covid, that causes people to get T1 wotsits.

Benching the athletes is the absolute WORST thing to do, to protect their hearts.
Missing some Tweet in this thread? You can try to force a refresh.

Keep Current with Prof Darrel Francis ☺ Mk CardioFellows Great Again

Profile picture

Stay in touch and get notified when new unrolls are available from this author!

Read all threads

This Thread may be Removed Anytime!

Twitter may remove this content at anytime, convert it as a PDF, save and print for later use!

Try unrolling a thread yourself!

how to unroll video

1) Follow Thread Reader App on Twitter so you can easily mention us!

2) Go to a Twitter thread (series of Tweets by the same owner) and mention us with a keyword "unroll" @threadreaderapp unroll

You can practice here first or read more on our help page!

Follow Us on Twitter!

Did Thread Reader help you today?

Support us! We are indie developers!


This site is made by just two indie developers on a laptop doing marketing, support and development! Read more about the story.

Become a Premium Member ($3.00/month or $30.00/year) and get exclusive features!

Become Premium

Too expensive? Make a small donation by buying us coffee ($5) or help with server cost ($10)

Donate via Paypal Become our Patreon

Thank you for your support!