This is now the officially funniest thing on earth.
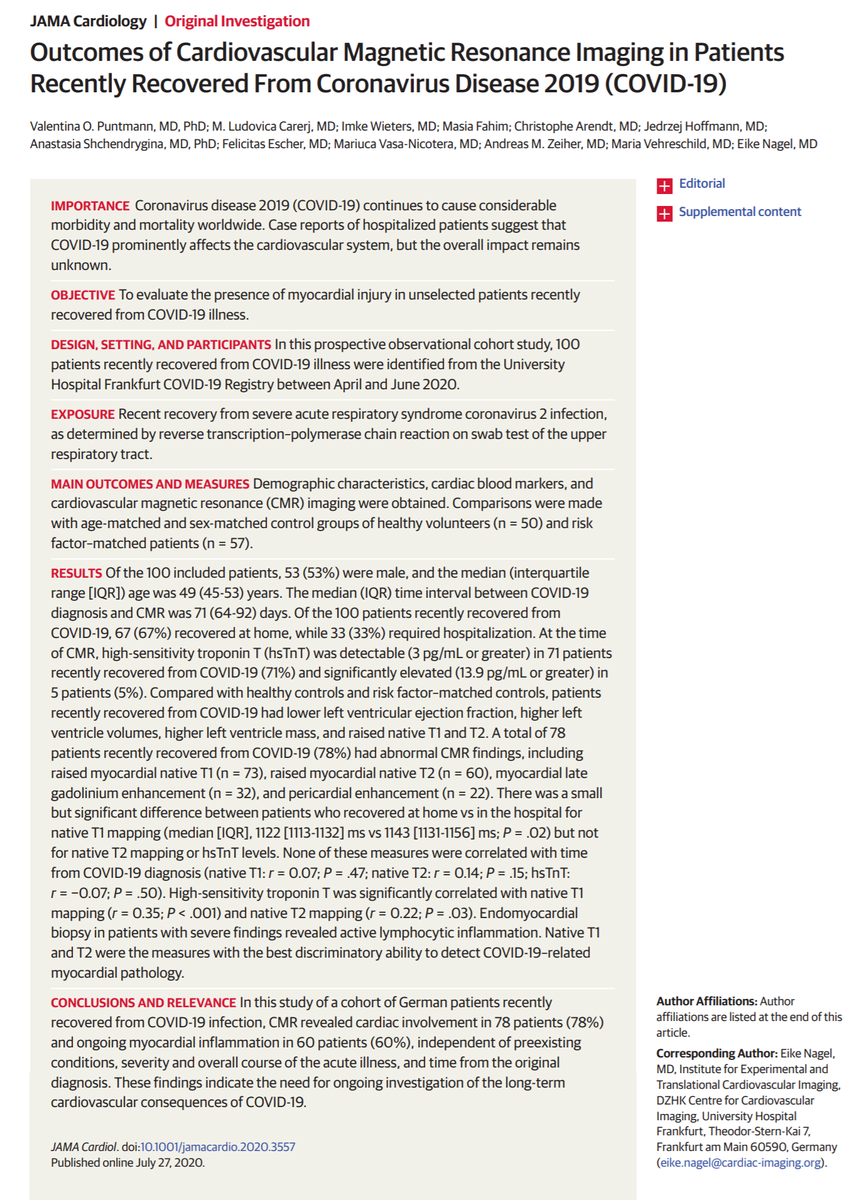
See in this tweet, the same image everyone has been tweeting, about the T2, T1, or whatever that is all funny or something, in the hearts of people who have had covid?
See in this tweet, the same image everyone has been tweeting, about the T2, T1, or whatever that is all funny or something, in the hearts of people who have had covid?
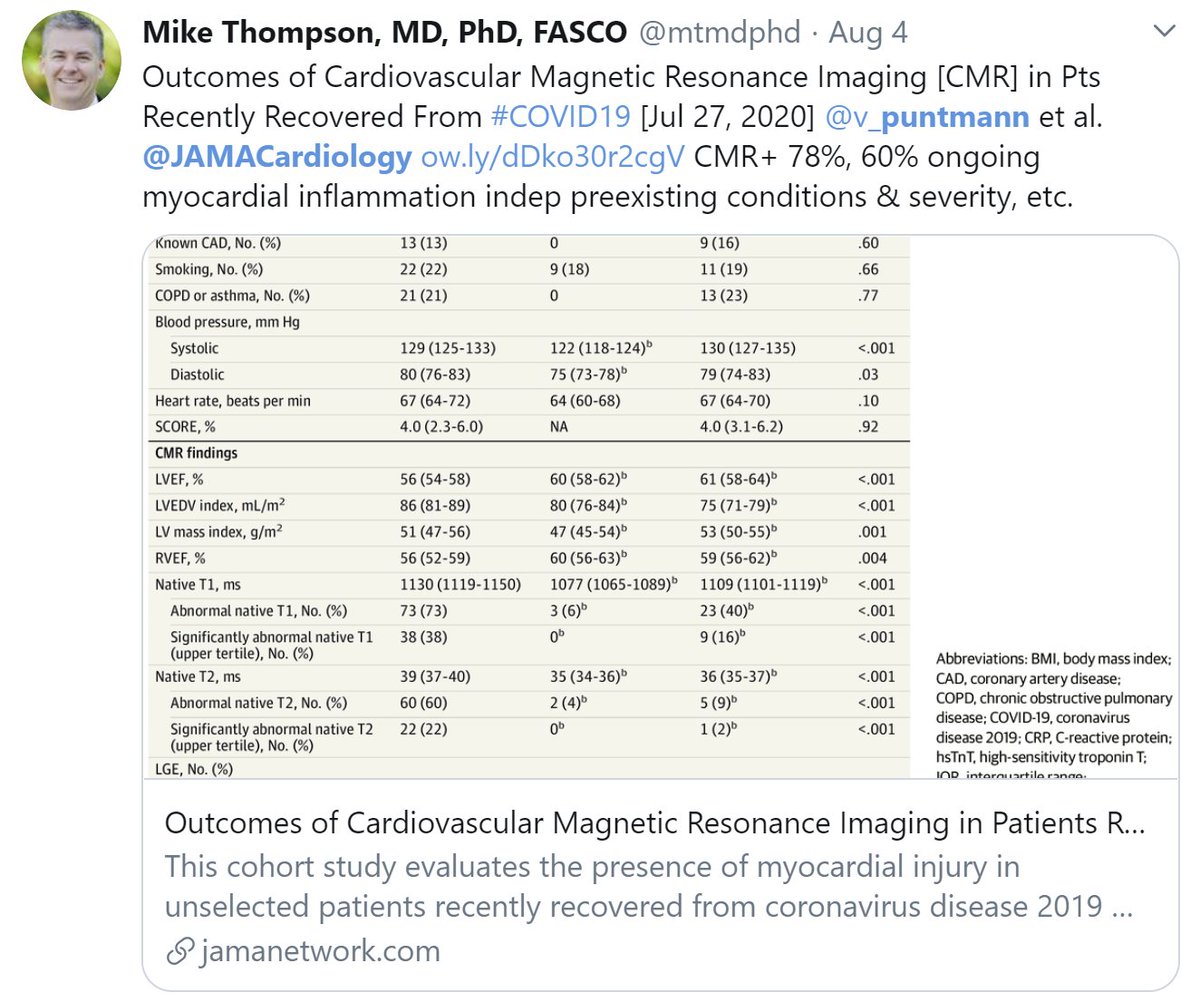
All you have to do is look at the very image that is being tweeted ...

Start at the start of the CMR stuff, if you like.

Oops. Insta-fail.
That is definitely not a median and interquartile range of EFs.
Right away, dead.
Don't need to read any more.
That is definitely not a median and interquartile range of EFs.
Right away, dead.
Don't need to read any more.
What's so staggering is that so many people have tweeted that image, and said this and that and whatever, blah blah.
WITHOUT READING WHAT IS RIGHT IN FRONT OF THEIR FACE
WITHOUT READING WHAT IS RIGHT IN FRONT OF THEIR FACE
So we can't really blame journalists.
We ourselves, in medicine, can't be bothered to read what we tweet.
Hahaha
The disclaimer should be:
"Retweet doesn't imply that I have even looked at it, never mind approve it!"
We ourselves, in medicine, can't be bothered to read what we tweet.
Hahaha
The disclaimer should be:
"Retweet doesn't imply that I have even looked at it, never mind approve it!"
If we as a profession are happy to retweet gibberish, we can't blame universities, sports associations and governments for talking nonsense.
8-)
Venk Murthy has just sent me this. I have no idea what a Big Ten is, but it is getting taken in by the nonsensical numbers.
8-)
Venk Murthy has just sent me this. I have no idea what a Big Ten is, but it is getting taken in by the nonsensical numbers.

Ah, I was assuming too much.

If the interquartile range of EF is 54 to 58, what proportion of EFs lie in the range 54 to 58?
And has that ever happened? Like, ever?
Clue.
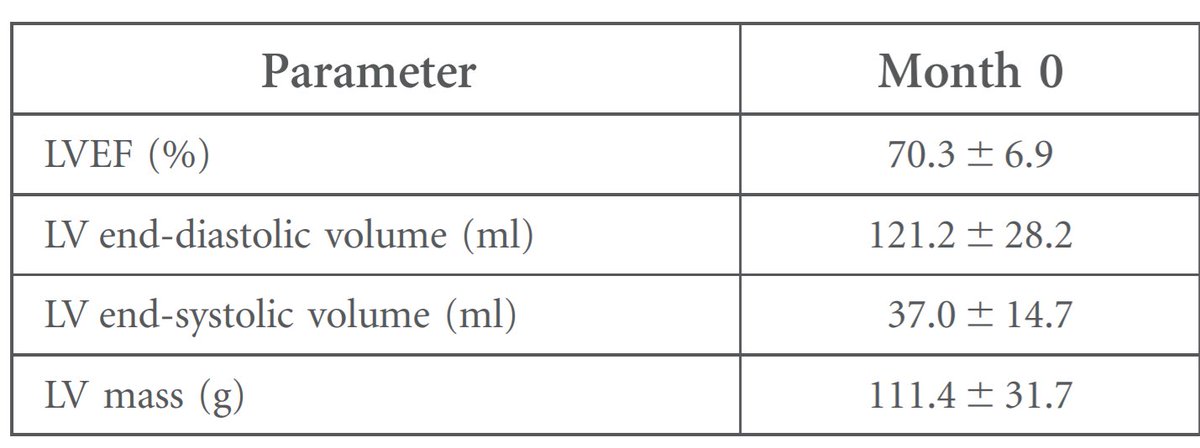
According to this paper by the level headed and sensible Rick Steeds and team:
Here is the mean and SD of EF on MRI.
According to this paper by the level headed and sensible Rick Steeds and team:
Here is the mean and SD of EF on MRI.
Er wait, let's make it even more super-easier.
I measure the weights of 100 people walking past me on a busy London street.
I announce that HALF OF ALL THE PEOPLE weight between 70 and 74kg (very very roughly 140 to 148 lbs, for people still in the previous millenium)
Is this plausible?
I announce that HALF OF ALL THE PEOPLE weight between 70 and 74kg (very very roughly 140 to 148 lbs, for people still in the previous millenium)
Is this plausible?
It's possible, of course, in the sense that anything is possible.
It is possible, that I am the Queen of Greenland.
Just not _plausible_.
You can calculate the probability of it. Let's do that for fun.
It is possible, that I am the Queen of Greenland.
Just not _plausible_.
You can calculate the probability of it. Let's do that for fun.
Suppose you had a variable that had an SD of 7 units across the population, like EF.
Grab someone off the street at random and measure their EF, what is the probability their EF will be WITHIN 2 UNITS of the mean?
Grab someone off the street at random and measure their EF, what is the probability their EF will be WITHIN 2 UNITS of the mean?
I hope you all know the ROUGH size of the numbers here.

Within 1 SD of the mean, is "about 2/3" of the data.
Within 2 SD of the mean, is "about 95%" of the data.
(The latter is why +/-1.96 SE's give you the 95% CI)
Within 2 SD of the mean, is "about 95%" of the data.
(The latter is why +/-1.96 SE's give you the 95% CI)
So we want to know the probability not of being ANYWHERE in those middle two bands (from -1 SD to +1 SD) but in the middlest part of them.
Since ±7 EF units is ±1 SD,
Therefore ±2 EF units (which is what we want)
is ±1 how many SD's?
Since ±7 EF units is ±1 SD,
Therefore ±2 EF units (which is what we want)
is ±1 how many SD's?
Wow, all 6 of the first 6 are correct.
I must have died of Covid and gone to heaven.
(Shame, it means the rectal Ozone didn't work)
I must have died of Covid and gone to heaven.
(Shame, it means the rectal Ozone didn't work)
So very very roughly, we have 2/7 of the WIDTH of the +/-1 SD, so let's say it is about 2/7 of the "about 2/3", shall we?
On that basis, the area would be:
On that basis, the area would be:
And 4/21ths is a little under 1/5, i.e. ~20%.
Of course the 4/21 estimate is a bit low, because the middle bit of the normal distribution is higher than the outside bit.
So let us raise the estimate a bit.
From 4/21 which is under 20%,
To, say, 25%?
Of course the 4/21 estimate is a bit low, because the middle bit of the normal distribution is higher than the outside bit.
So let us raise the estimate a bit.
From 4/21 which is under 20%,
To, say, 25%?
So the chance of a random person's EF,
drawn from a population which had the most favourable mean, and typical SD (7 units),
having a value within ±2 of the mean,
is about 25%.
drawn from a population which had the most favourable mean, and typical SD (7 units),
having a value within ±2 of the mean,
is about 25%.
Thank you to @pouyatafti for pointing out the correct calculation.
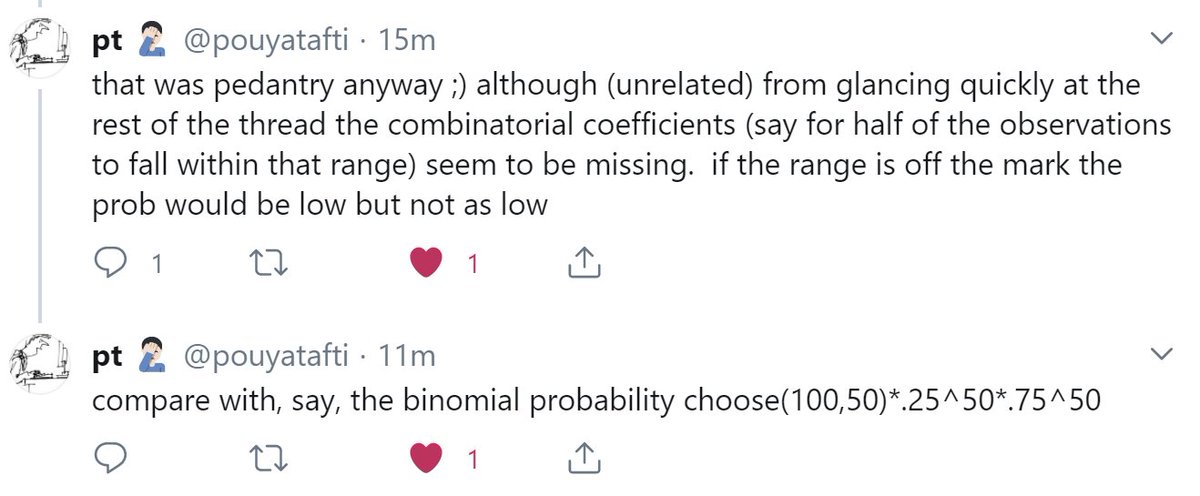
In a normal distribution, the SD is about 3/4 the IQR.
An IQR of 4, which is what is described in the JAMA Cardiology paper, therefore implies an SD of about 3.
An IQR of 4, which is what is described in the JAMA Cardiology paper, therefore implies an SD of about 3.
Getting an SD of 3, instead of an expected SD of (say) 7, means getting a variance of 9 instead of 49.
See the problem?
A very, very, small variance. About 1/5 of what it should be.
See the problem?
A very, very, small variance. About 1/5 of what it should be.
Very very unlikely. But how unlikely?
Wikipedia to the rescue.
Wikipedia to the rescue.

The variance of the a sample variance,
is the population variance, squared, times 2/sqrt(N).
The population variance is 49.
Squared is about 2500.
Times 2/sqrt(100) is
is the population variance, squared, times 2/sqrt(N).
The population variance is 49.
Squared is about 2500.
Times 2/sqrt(100) is
Don't get confused. This is a different number, that just happens to be about the same.
So what is the SD of the variance?
So what is the SD of the variance?
And we need the sample variance to come down from the typical 49, to 9.
i.e. down by 40.
That is almost 4 lots an SD-of-variance.
That puts us almost outside the whole of this graph, here!
i.e. down by 40.
That is almost 4 lots an SD-of-variance.
That puts us almost outside the whole of this graph, here!

So it is not impossible, but I think I can fairly say that "the probability is approximately zero".
Thread continues here, because I have removed some tweets in between that aren't needed.