
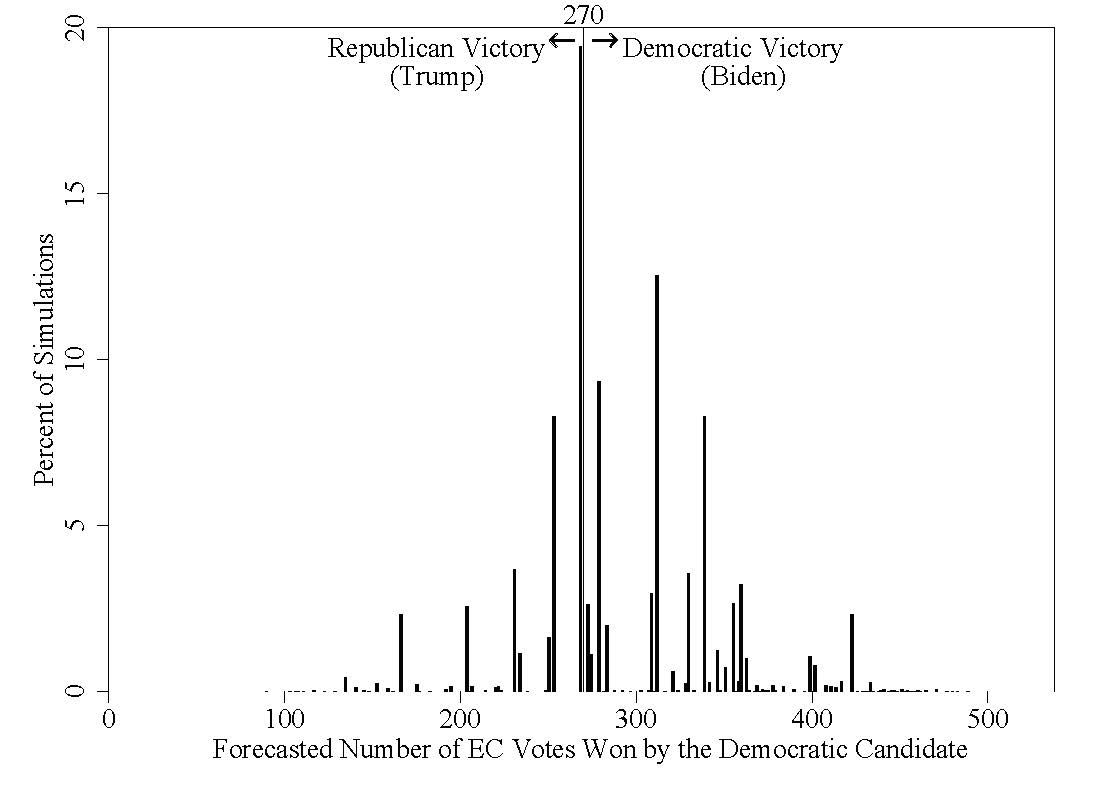
2020 Election Forecast with @JuliusLagodny @cornellgov forthcoming in @ps_polisci: about 6-in-10 chance #BidenHarris win the Electoral College, about 1/5 chance #TrumpPence get exactly 270 EC votes. (1/4) 
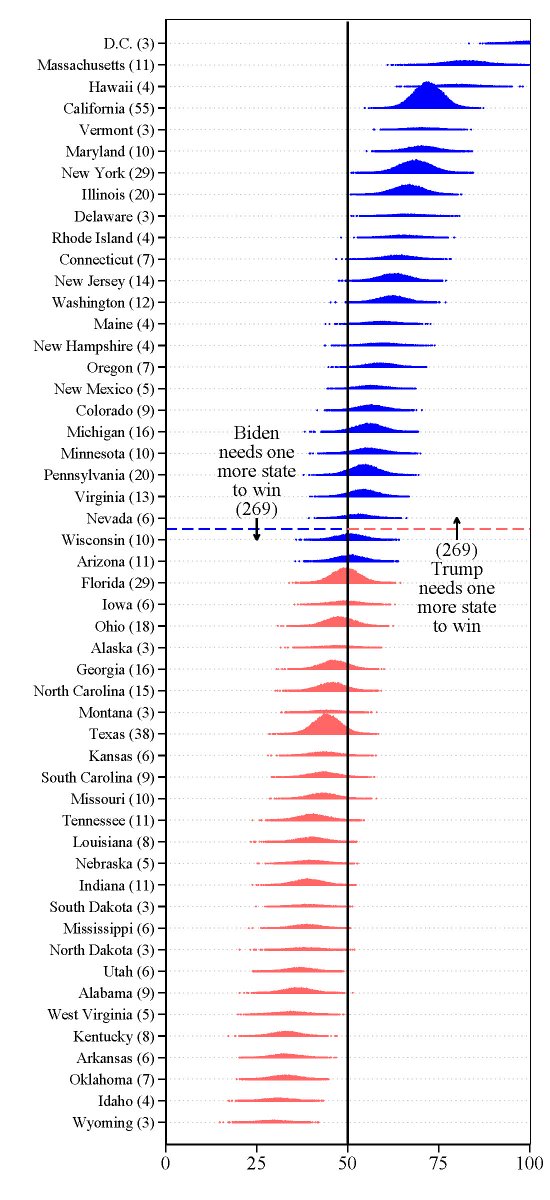
Our state-by-state forecast, Dark blue=expected Dem win, Light red=expected Rep win; distributions centered around 50% could go either way; distribution height =Electoral College importance. (2/4)
Forecast model based primarily on state presidential approval (MRP of almost 90,000 respondents from @RoperCenter @Cornell), state economic conditions, and past state vote. (4/4)
• • •
Missing some Tweet in this thread? You can try to
force a refresh


