Let talk graphic, poster and infographic design!
What does this involve? Most of it is contrast and fonts but spacing and layout can also come into it.
What does this involve? Most of it is contrast and fonts but spacing and layout can also come into it.
How can you figure out what colors have good contrast?
Rule of thumb is opposites for background and foreground. One light, one dark.
Rule of thumb is opposites for background and foreground. One light, one dark.
But how can you check if your images have good contrast?
Luckily there are many different websites out there that can check contrast of graphics and websites for you!
Here's some examples of websites you can use to check contrast [webpage 1] contrastchecker.online
Luckily there are many different websites out there that can check contrast of graphics and websites for you!
Here's some examples of websites you can use to check contrast [webpage 1] contrastchecker.online
Contrast checker webpage 2 [link] color.a11y.com/ContrastPair/?…
Contrast checker webpage 3 [link] contrastchecker.com
Contrast checker webpage 3 [link] contrastchecker.com
There also options to check your image contrast for people with color blindness such as [webpage link] color-blindness.com/coblis-color-b…
Generally people know about red-blue or red-green color blindness but there are many different types and they are often the most commonly used colors!
Generally people know about red-blue or red-green color blindness but there are many different types and they are often the most commonly used colors!
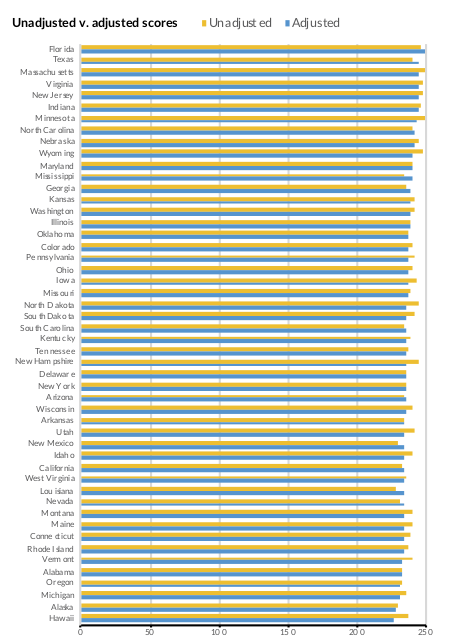
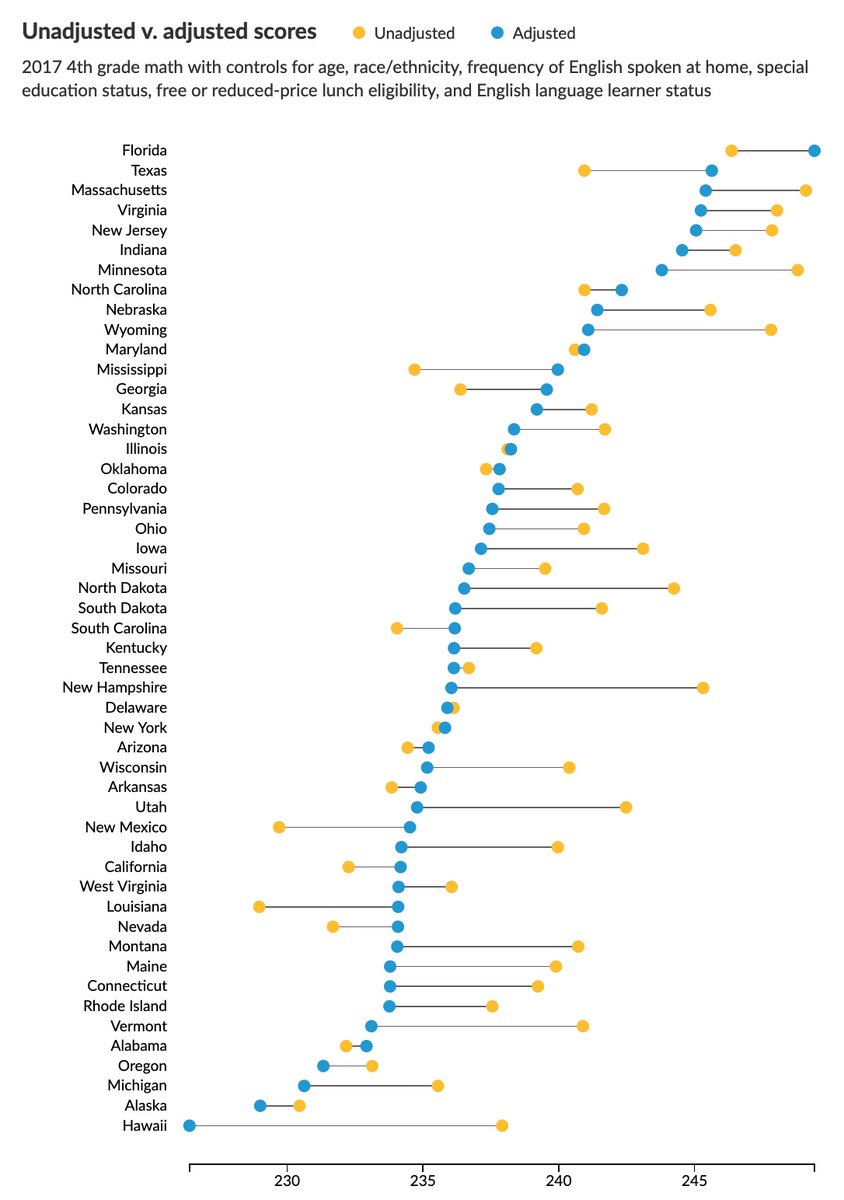
People may not think they use colors that those with color blindness cant differentiate between but blue-red combinations are super common with graphs and data visualization.
If you are someone who uses R for data visualization there are codes you can use for ggplot2 to make your data visualization colour blind friendly! [Webpage link] rdrr.io/cran/ggthemes/…
In terms of layout white space is your friend. Make sure have spacing between lines, and keep text to a minimum size of around 12 to 14 or larger depending on your medium. For presentations and posters a minimum of 18/20 is my go to.
What about fonts? Readability & font style can be very linked. Sans serif fonts are best but design fonts such as Raleway, Avent Pro, Montserrat and Roboto are also good.
The British Dyslexia Society has a style guide to help on this [webpage link] bdadyslexia.org.uk/advice/employe…
The British Dyslexia Society has a style guide to help on this [webpage link] bdadyslexia.org.uk/advice/employe…
The main point is you can do whatever you want as long as you are doing your best to be accessible!
A major myth is that accessible design cant be nice and look good! That is not true!
You can do so many amazing things that can accessible!
A major myth is that accessible design cant be nice and look good! That is not true!
You can do so many amazing things that can accessible!
Infographics & posters also come under all the things I've mentioned above but a really important point is that you need to provide a transcript with them!
So many people dont realise that these are still images that can't be read by screen-readers.
So many people dont realise that these are still images that can't be read by screen-readers.
The easiest way to deal with this is to link an uneditable google doc (a google doc link that has been changed to viewer only) with the text given on them as well as alt text for any revelant images and figures!
But how can you do this for in-person posters (as are so common)! One way is to create a QR code that is linked to the transcript!
This makes your content suitable for those who are visually impaired or have difficult reading your poster as it is!
This makes your content suitable for those who are visually impaired or have difficult reading your poster as it is!
One thing I (personally) despise is conference posters & I know they aren't everything in scicomm but I still want to mention.
Majority of the time, I can't read conference posters because people haven't dont have good contrast, or font sizes or spacing that have readibility.
Majority of the time, I can't read conference posters because people haven't dont have good contrast, or font sizes or spacing that have readibility.
Personally I really like @OpenAcademics layout for posters! 

• • •
Missing some Tweet in this thread? You can try to
force a refresh