This study adds very, very little to the literature.
In addition to the anomaly listed below wherein LVEF of 33 is described as normal there are a few other things that caught my eye.
In addition to the anomaly listed below wherein LVEF of 33 is described as normal there are a few other things that caught my eye.
https://twitter.com/DrAMcCullough/status/1304436564223762432
First, the pericardial effusions do not seem to be clearly more than physiologic.
Unlike Puntmann, there is no pericardial LGE identified.
Unlike Puntmann, there is no pericardial LGE identified.
There are 4 cases which meet Lake Louise criteria for myocarditis.
These were developed in people who have clinicial suspicion of myocarditis so their performance here is less clear.
These were developed in people who have clinicial suspicion of myocarditis so their performance here is less clear.
These cases do not have abnormalities in T1 or ECV suggesting that there is no diffuse abnormality of the myocardium (different from Puntmann, again).
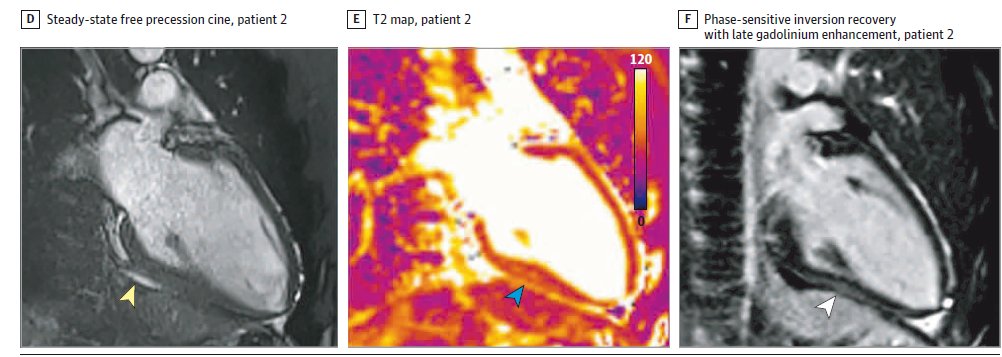
Now let's turn to the LGE. We are provided two case examples, presumably the most concerning examples out of the four.
Here is the first patient:
Here is the first patient:

There does appear to be inferior insertion point LGE. This is non-specific and may be common in some types of athletes.
The other findings are subtle and could easily be passed, depending on what other views of the scans look like, especially because we are told there are no systolic function abnormalities.
The second case is more concerning for real LGE, though again artifact is in the realm of possible and an orthogonal view would be helpful.
One nice thing is that the authors have a detailed table of all of the findings.
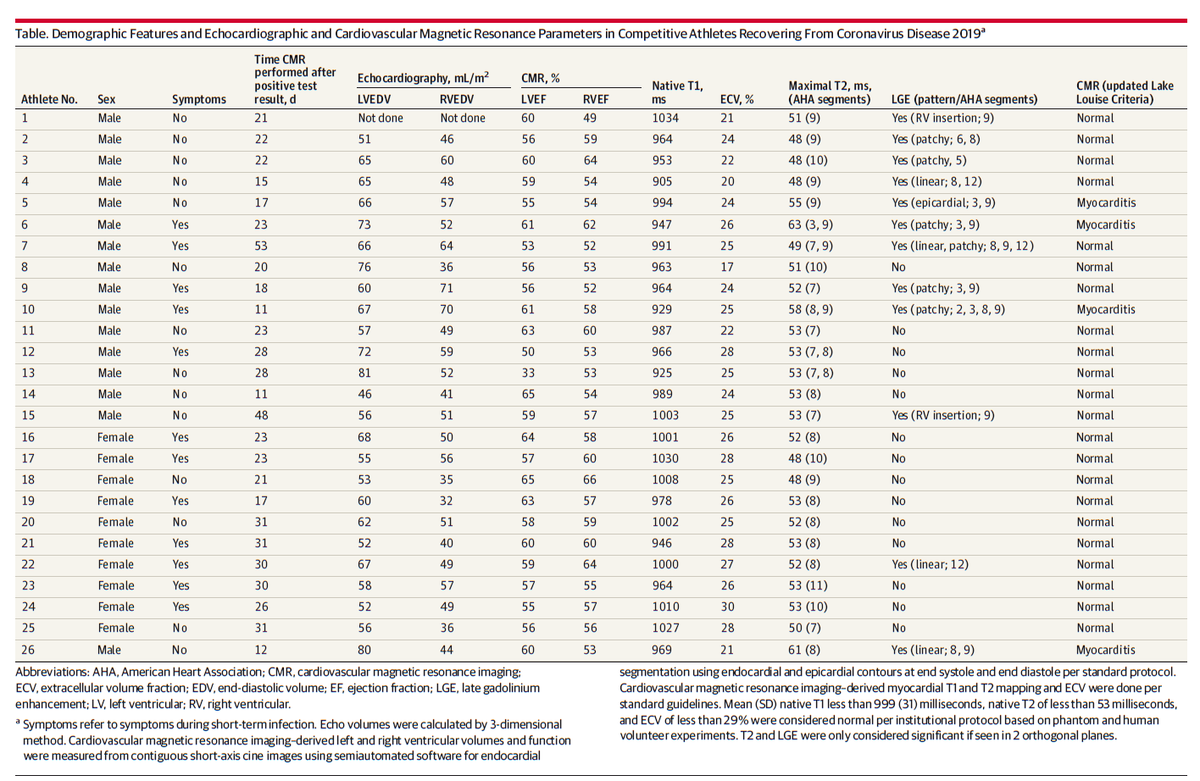
I did find it odd that they somehow came up with an RVEF of 49 for athlete #1 without an RVEDV. I assumed it was visual, but strange to call it 49% rather than 50% if eyeballing it. Maybe a very fastidious reader?
Another important point is that none of the 4 myocarditis cases note RV insertion point LGE so the first case must be "patchy" as the descriptor.
Given that, and the fact that many of the affected segments are septal segments, I wonder how many of these are insertion point LGE +/- very subtle/equivocal other stuff?
Indeed of the 23 segments affected across all athletes, just 5 are outside of the septum. This is a bit different from what I would have expected.
I've discussed these findings with 5 mid career to senior MRI readers I trust and none found these overwhelmingly clear or convincing as bad or serious LGE (and the images are the best two cases presumably).
I wonder how the interpretations would have differed if they occurred in blinded fashion with controls mixed in.
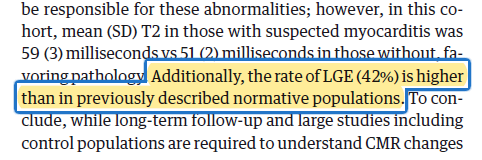
There is also at least one other numerical error. They report 42% LGE in the discussion and 46% in the results section. The correct number appears to be 46% based on the table. Presumably a typo.
But they don't provide a citation for the claim about normative populations.
But they don't provide a citation for the claim about normative populations.
At least some athlete populations can have LGE in this range of prevalence, especially given many of the findings called here appear rather subtle and potentially artifact.
https://twitter.com/venkmurthy/status/1303831786200469504?s=20
This is ultimately why I think this adds little to the literature.
Without a control group, we really have no way to assign causation. Is this due to COVID? Is this due to some other recent virus? Is this due to training?
Without a control group, we really have no way to assign causation. Is this due to COVID? Is this due to some other recent virus? Is this due to training?
We also have no data provided on arrhythmias, exercise capacity or much of anything else.
How could this have been done better without necessarily a total redesign of the study to include controls?
I would think it would be good to have:
1. Inter-rater reliability: does another reader agree with these findings? Given the subtle nature of some of the findings, maybe it would be good to see if another reader agreed consistently.
1. Inter-rater reliability: does another reader agree with these findings? Given the subtle nature of some of the findings, maybe it would be good to see if another reader agreed consistently.
2. Blind reading of all/some with mixed in scans from another population. Could the primary reader have *unconsciously* over-called the findings? Putting in some scans into the pile that were clinical patients that were called normal might be a good double check on this.
Under normal circumstances many papers are published without these.
However, given the massive stakes here in the COVID era wherein rumors of this data were driving the news and even policy decisions, I think an extra day or two of work would probably have been a good trade-off.
However, given the massive stakes here in the COVID era wherein rumors of this data were driving the news and even policy decisions, I think an extra day or two of work would probably have been a good trade-off.
But the most critical thing here is to realize this is very preliminary data at best. It is not conclusive and thus I say it adds only a tiny bit to the literature.
This is not "debate over, if you disagree you are a denialist" type data.
This is not "debate over, if you disagree you are a denialist" type data.
Now the caveats:
1. COVID is a serious condition and it should be taken very seriously, regardless of these CMR studies.
1. COVID is a serious condition and it should be taken very seriously, regardless of these CMR studies.
2. There are many reasons not to have or not have college sports this season *independent* of this issue. Leaning too heavily on this issue, which has weak data is suboptimal.
3. Neither I nor most people who have concerns over these data are denying that anyone has COVID myocarditis. Indeed it is very likely that some people have had COVID myocarditis.
What I am concerned about is the notion that even among people with no symptoms, there is raging, "carnage" of the heart muscle cells, with long term implications of a "wave" of heart disease/failure.
As of yet there is no data to support such talk, IMO.
As of yet there is no data to support such talk, IMO.
We certainly should keep our eyes open, and keep doing carefully executed and well controlled research. It is definitely premature to induce panic, however.
• • •
Missing some Tweet in this thread? You can try to
force a refresh