Analysis: #NASDAQ $MRNS
Case 476 #MarinusPharmaceuticals Inc
DISCLAIMER: The analysis is strictly for educational purposes and should not be construed as an invitation to trade.
#MRNS 1/4
Case 476 #MarinusPharmaceuticals Inc
DISCLAIMER: The analysis is strictly for educational purposes and should not be construed as an invitation to trade.
#MRNS 1/4

Chart 1
Weekly Chart: Since trading to the lowest low of 0.77 in July 2019, conditions have been restricted to a tight range, the inability to trade above the #SMA 200 shows a lack of interest by bulls. Price needs to close above a minimum of 4.25 (Aug. 2015 .....
MRNS 2/4
Weekly Chart: Since trading to the lowest low of 0.77 in July 2019, conditions have been restricted to a tight range, the inability to trade above the #SMA 200 shows a lack of interest by bulls. Price needs to close above a minimum of 4.25 (Aug. 2015 .....
MRNS 2/4
..... #trendline). Minor #resistance appears around 5.77- 6.40 with a close/hold above the latter targeting 8.16. #Support begins at 2.40/20 with much greater demand around 1.35. Farther down Dec. 2016 trendline at 0.74 and balance point at 0.50.
MRNS 3/4
MRNS 3/4
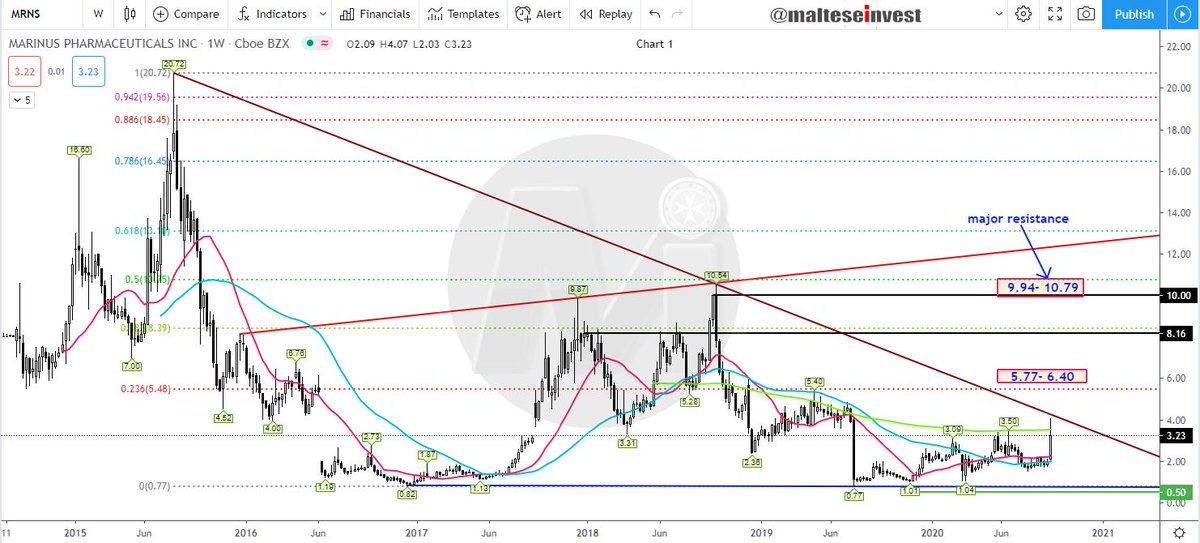
Chart 2
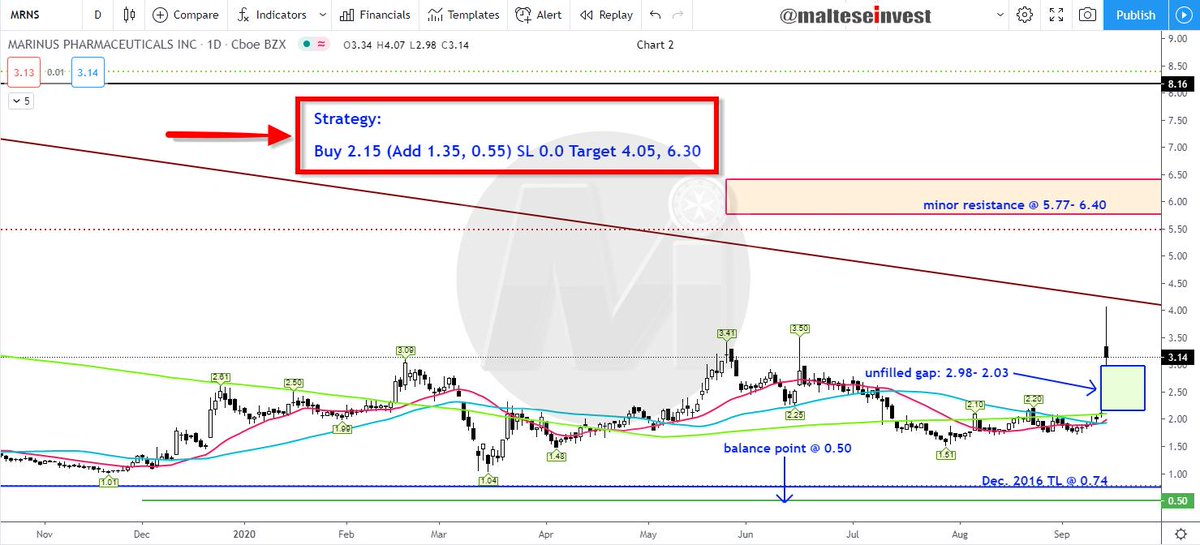
Daily Chart: An unfilled gap exists between 2.98- 2.03.
The #Strategy is printed on the image.
$MRNS 4/4
Daily Chart: An unfilled gap exists between 2.98- 2.03.
The #Strategy is printed on the image.
$MRNS 4/4
• • •
Missing some Tweet in this thread? You can try to
force a refresh