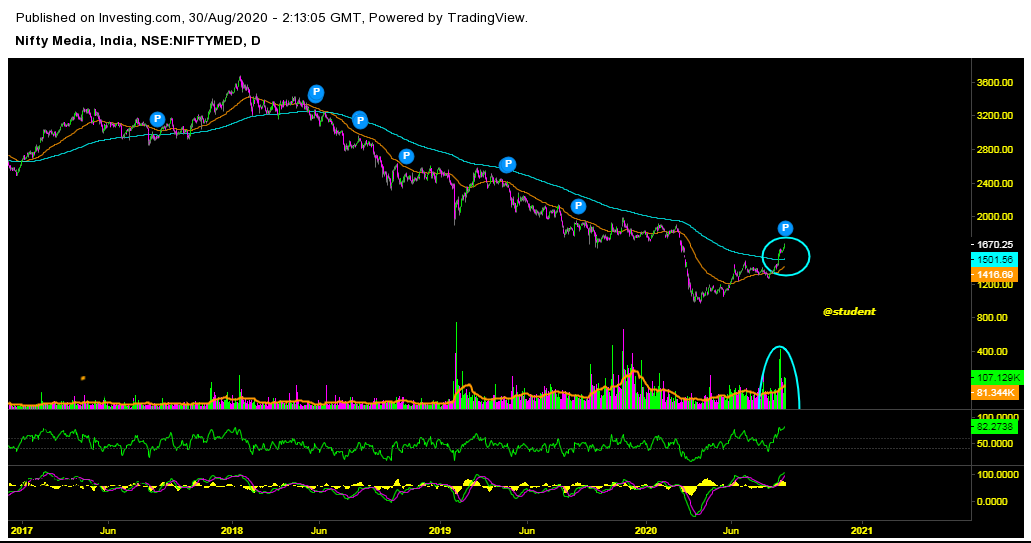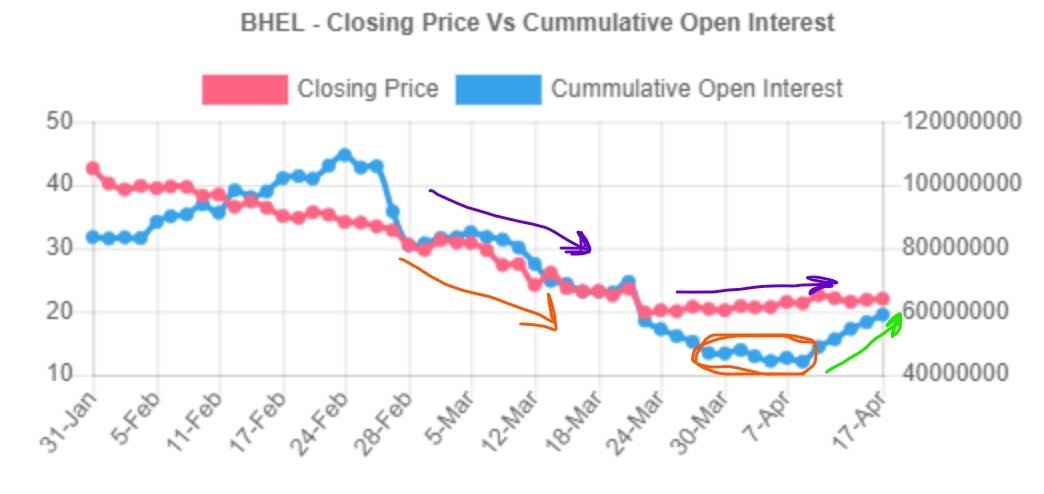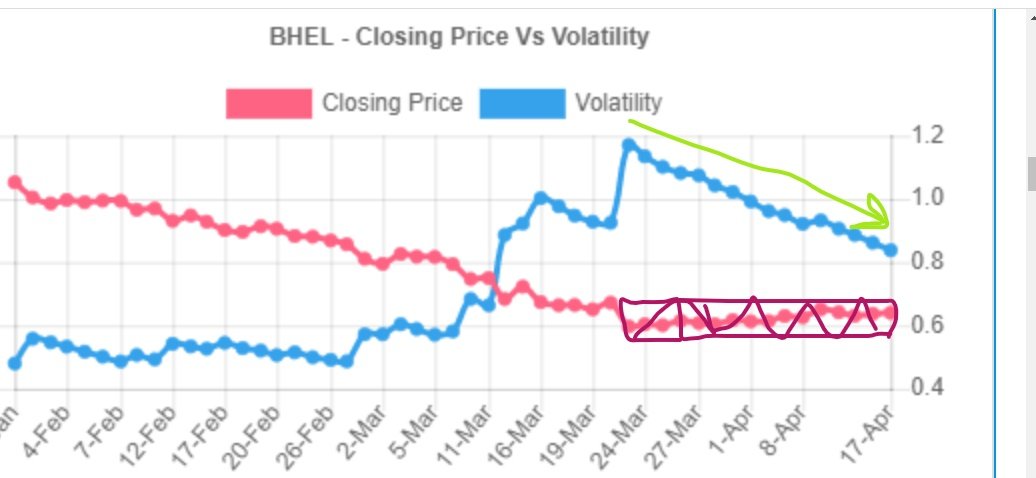
#IBULHSGFIN #HSGFINANACE #FNO #STOCKSTUDY
#DERIVATIVEDATA #OPTIONCHAIN
*** Stock has fallen 30% in last three months. Presently, at old b/o level consolidating.
*** This also seen as support on rising trend line.
*** Stock is making ascending triangle as well.
#DERIVATIVEDATA #OPTIONCHAIN
*** Stock has fallen 30% in last three months. Presently, at old b/o level consolidating.
*** This also seen as support on rising trend line.
*** Stock is making ascending triangle as well.

*** Delivery % data is showing slight pic up in delivery% with respect to its averages
trendlyne.com/equity/deliver…
trendlyne.com/equity/deliver…
*** Cumulative open interest is equally falling.
From 1981200 to 15304700.
*** Short Covering without significant increase in price.
From 1981200 to 15304700.
*** Short Covering without significant increase in price.
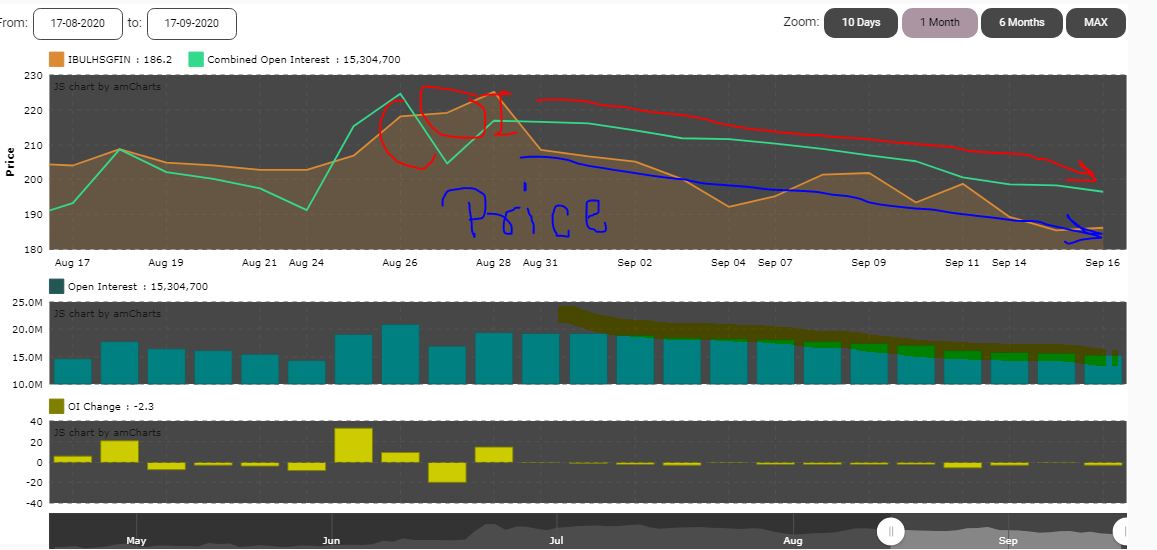
Interesting point to note is put writer at 200 strike is not at all worried about his position and shows his confidence level. 

So far there is negligible rollover in Oct & Nov 20 series.
***Short positions are not getting rolled over.

***Short positions are not getting rolled over.

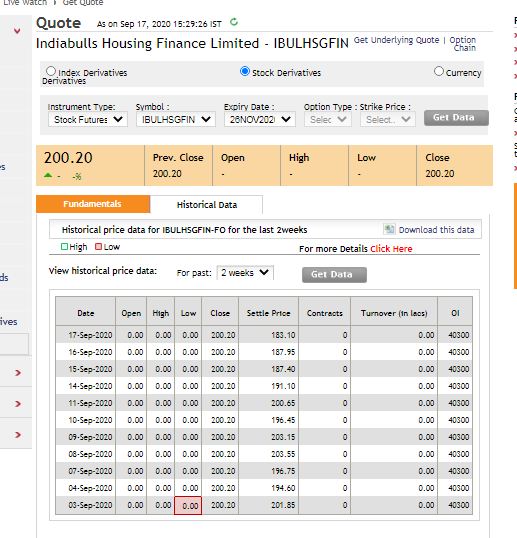
Its not buying or selling tip...
I have made an attempt to analyse the development in the stock. Further, position built up in Futures will show the bias of big boys.
Study further.
Share/RT if you learn anything from it.
I have made an attempt to analyse the development in the stock. Further, position built up in Futures will show the bias of big boys.
Study further.
Share/RT if you learn anything from it.
*** COI 19381200
• • •
Missing some Tweet in this thread? You can try to
force a refresh


