Ahmad Barclay @bothness.bsky.social Profile picture
Sep 21, 2020 11 tweets 9 min read Read on X
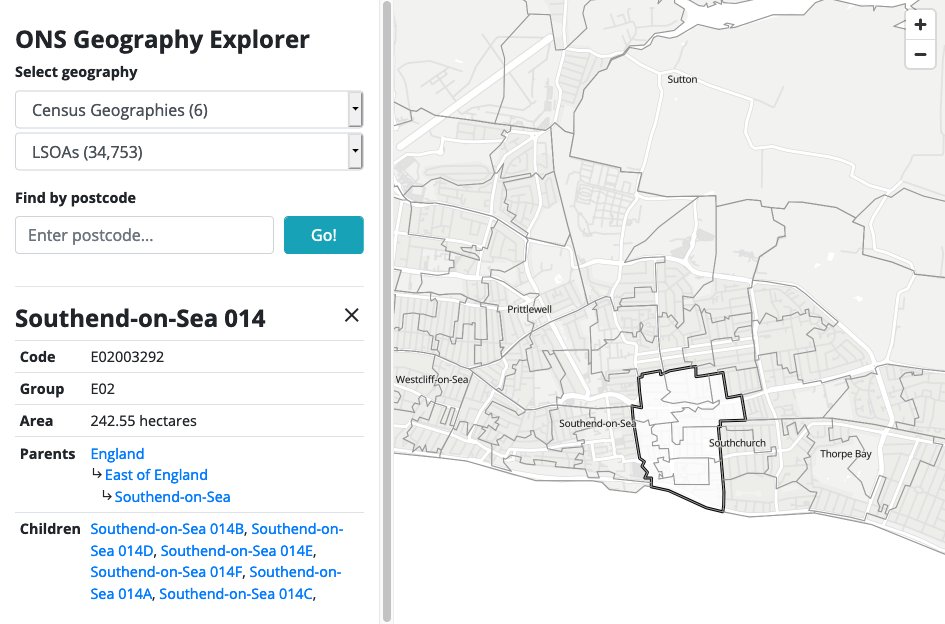
1/ Nerdy thread... I recently put together this tool for exploring @ONS statistical geographies & administrative regions for England & Wales. It's one of various prototypes that we're working on in the #DataVis team in thinking how to visualise @Census2021 bothness.github.io/geo-explorer/
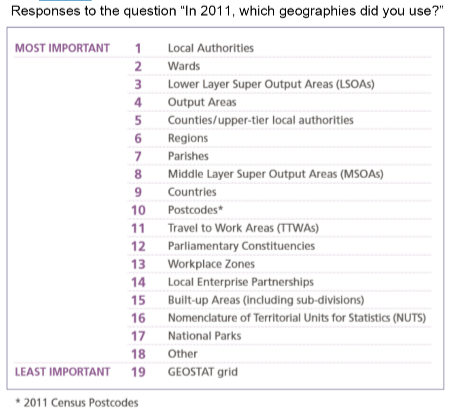
2/ Since joining @ONS a few months ago, I've been trying to make sense of the MANY geographies are used to report data across the UK, from neighbourhood level all the way up to national level, and to be honest it's been a challenge. Here's a list from the 2011 Census...
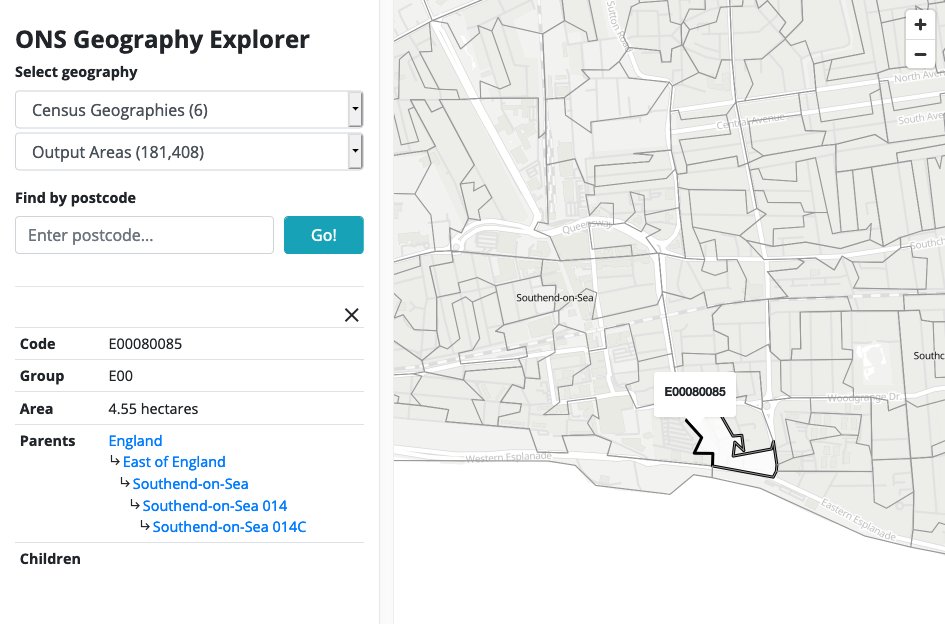
3/ The smallest "statistical building block" for census data in England & Wales is an Output Area, covering around 100 households. These areas are so small that there are over 180,000 of them, and they don't even have names, only 9-digit codes like E00080085
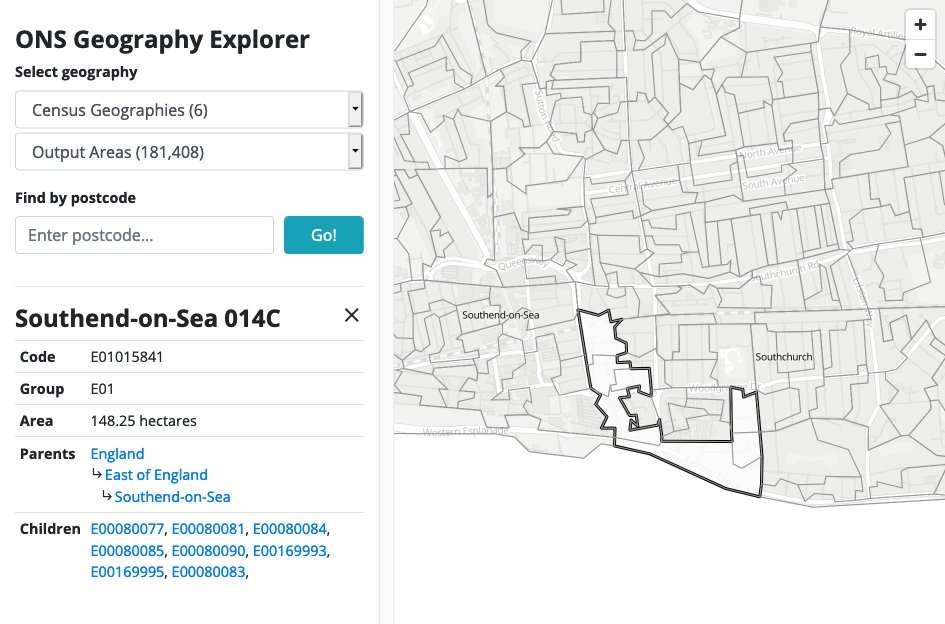
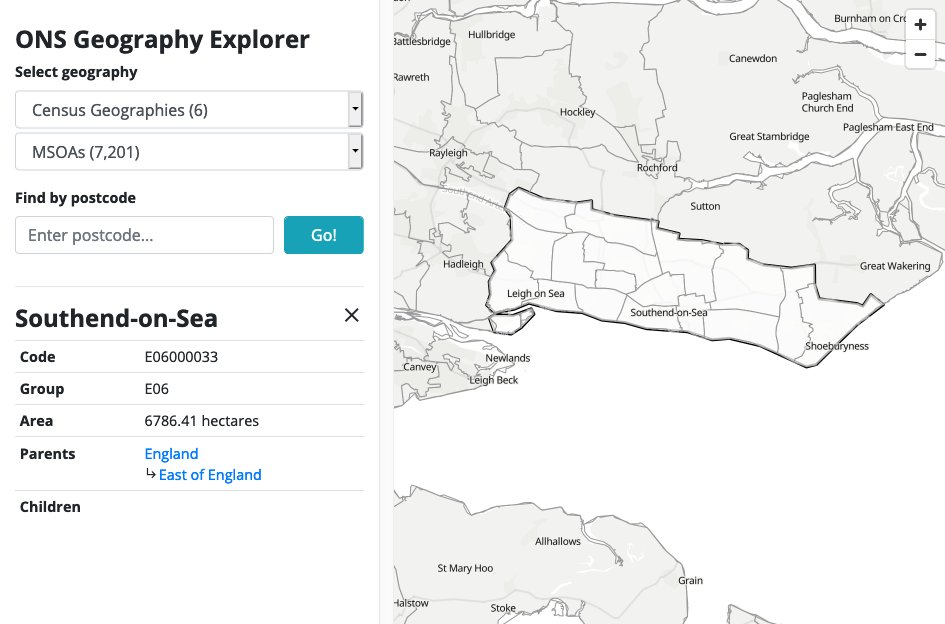
4/ These tiny areas are then clustered together into Lower-layer and Middler-layer “Super Output Areas”, known as LSOAs and MSOAs, which have slightly more memorable names like "Southend-on-Sea 014" and "Southend-on-Sea 014C"
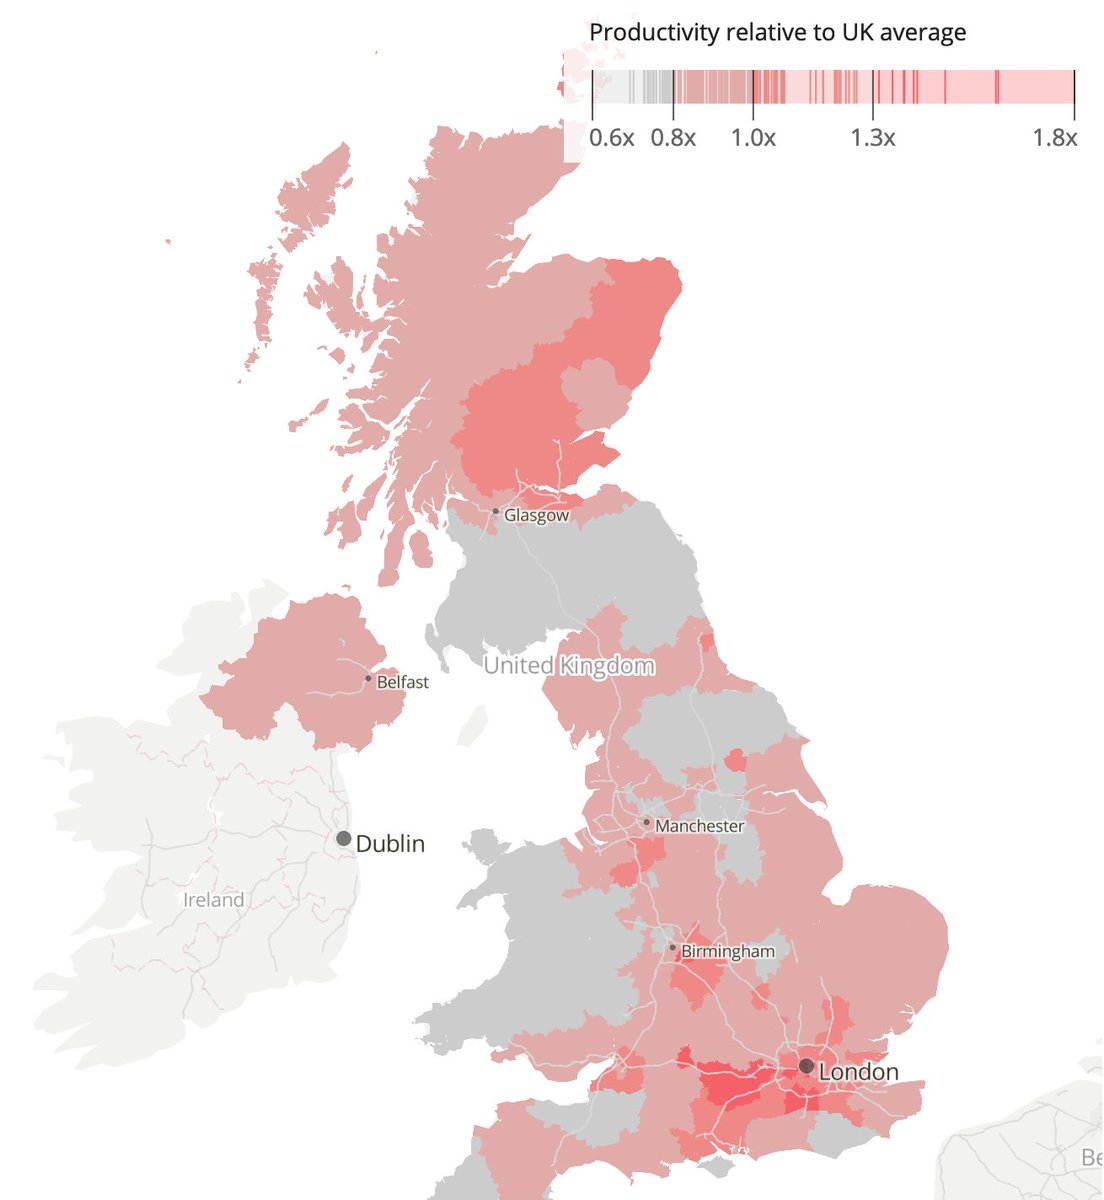
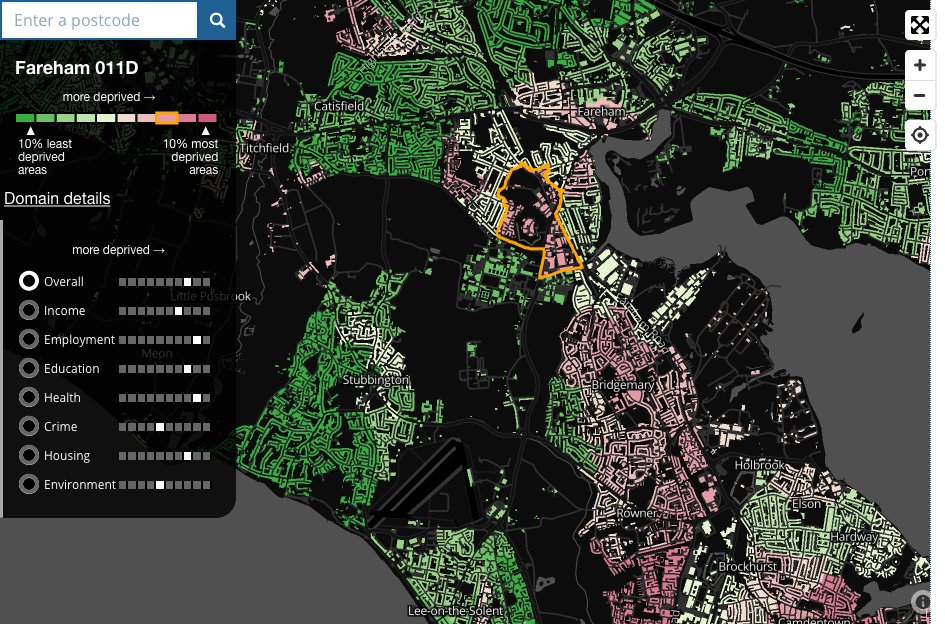
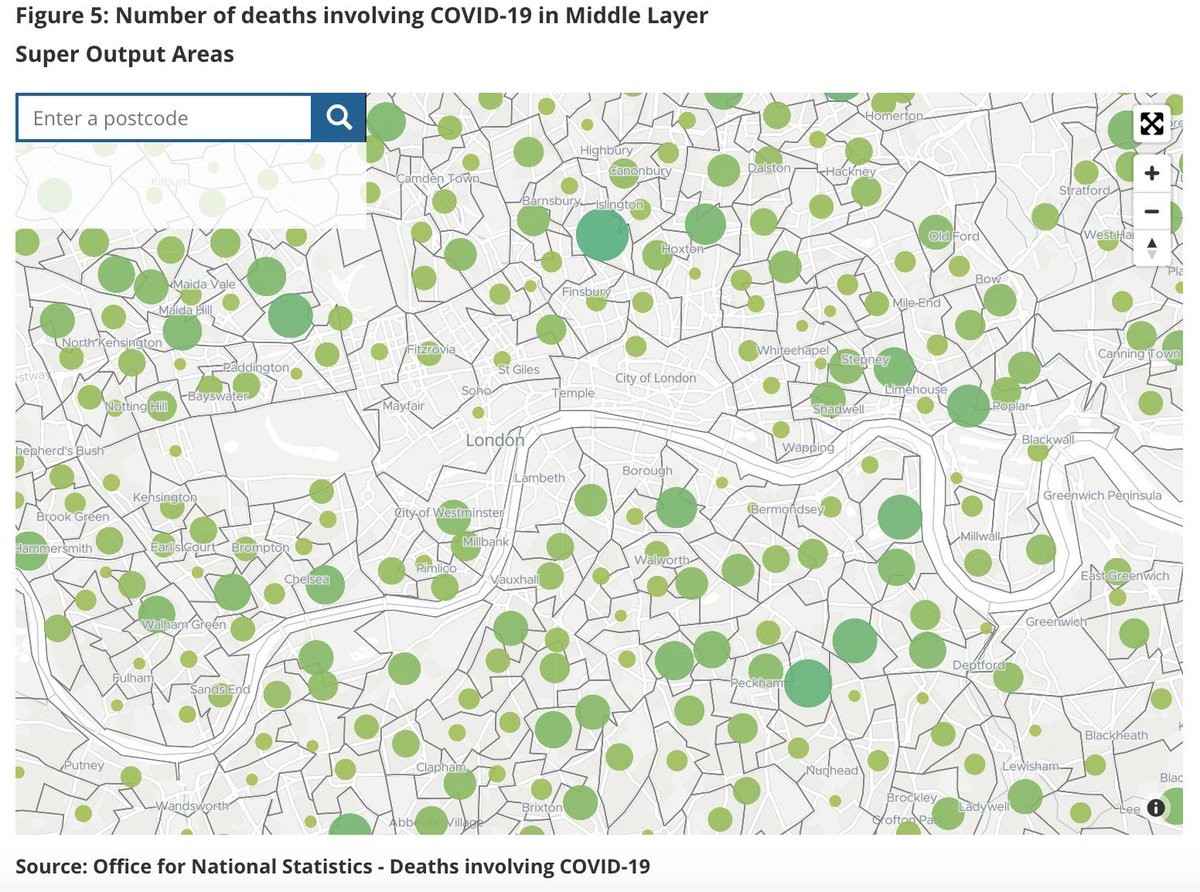
5/ MSOAs (& occasionally LSOAs) are also used outside of census years for reporting "small area” statistical data. Eg. my colleague @fryford created these maps at MSOA level for recent @ONS datasets on deprivation fryford.github.io/imdmap/ & #Covid19 deaths ons.gov.uk/peoplepopulati…
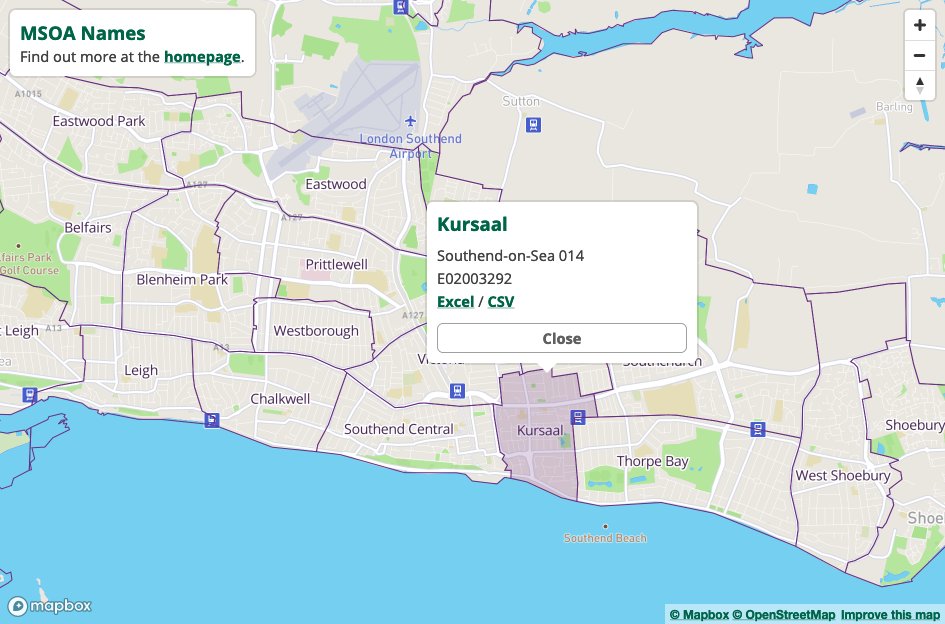
6/ The @commonslibrary helpfully put together a set of more recognisable (unofficial) names for MSOAs, based on the neighbourhoods, wards or parishes that they cover, to help make them a bit easier to make sense of. "Southend-on-Sea 014" becomes "Kursal" visual.parliament.uk/msoanames
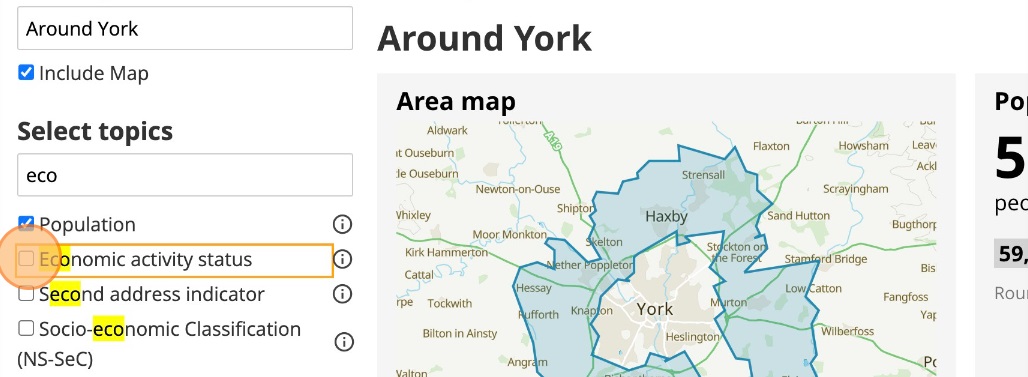
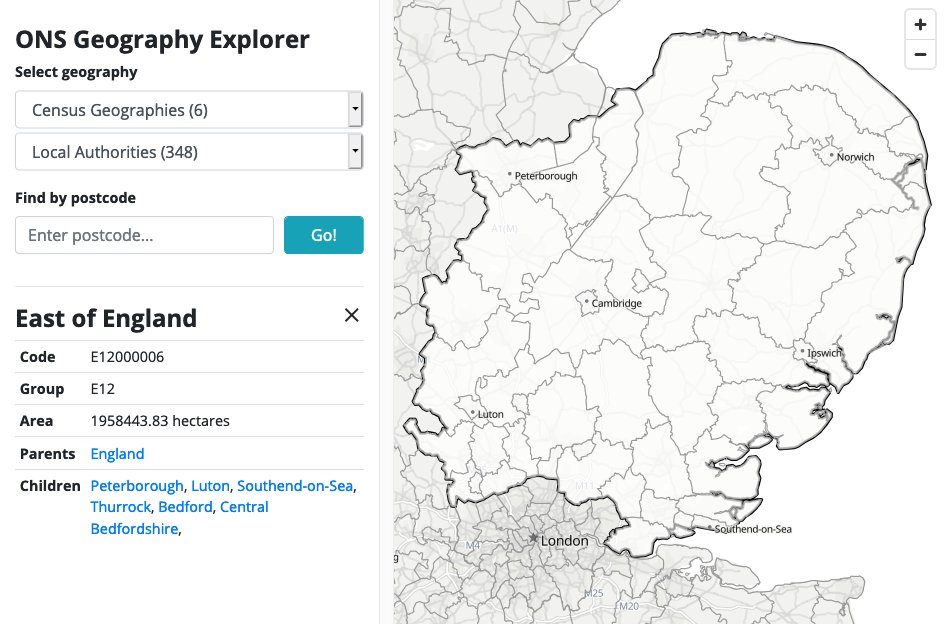
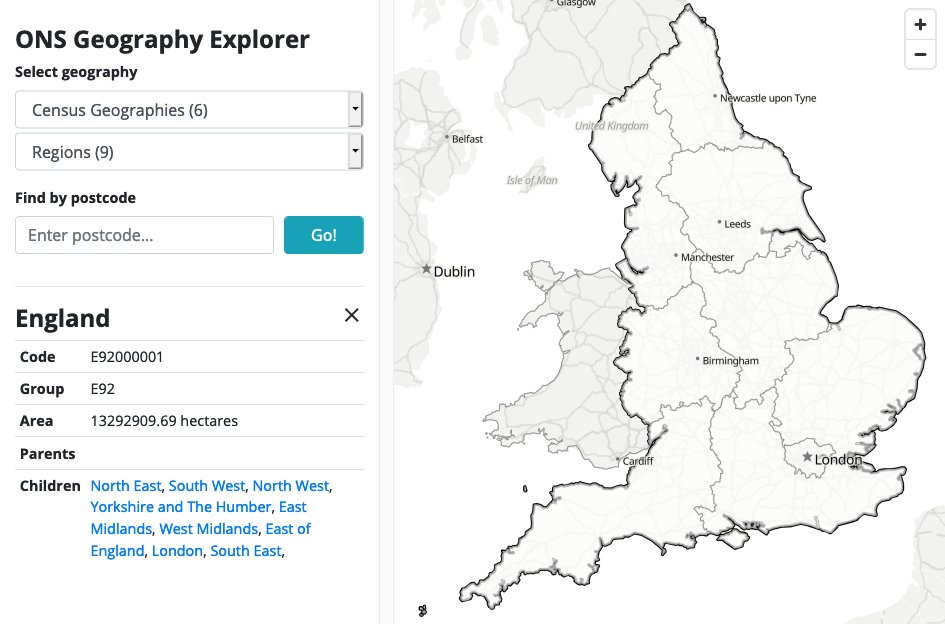
7/ Going back to the geography explorer, when we zoom out further, we start to see more recognisable higher level geographies, like local authority districts, regions and, finally, countries bothness.github.io/geo-explorer/
8/ But... Going back to the list at this top of this thread, there are alson a TON of other official @ONS geographies, including electoral wards, parliamentary constituencies, built-up areas and the GeoSTAT grid (the list is ordered by the ones people find most useful)
9/ The easiest way to get hold of @ONS datasets for most of these geographies (especially small area data) is via Nomis nomisweb.co.uk, but a lot of datasets can also be found via the ONS website ons.gov.uk, which should get much easier to use by @Census2021
10/ And... I couldn’t possibly end this thread without mentioning the fact that these geographies only cover England & Wales. Scotland and Northern Ireland data is reported using a whole host of other geographies administered by @ScotStat and @NISRA
11/ Ps. @geospacedman reminds me that there's this beast of a poster out there to show how all these other UK geographies _kind of_ fit together geoportal.statistics.gov.uk/datasets/9c04f…

• • •

Missing some Tweet in this thread? You can try to force a refresh
 

Keep Current with Ahmad Barclay @bothness.bsky.social

Ahmad Barclay @bothness.bsky.social Profile picture

Stay in touch and get notified when new unrolls are available from this author!

Read all threads

This Thread may be Removed Anytime!

PDF

Twitter may remove this content at anytime! Save it as PDF for later use!

Try unrolling a thread yourself!

how to unroll video
  1. Follow @ThreadReaderApp to mention us!

  2. From a Twitter thread mention us with a keyword "unroll"
@threadreaderapp unroll

Practice here first or read more on our help page!

More from @bothness

May 12, 2023
Next Monday (15 May) will mark 75 years since the Nakba, when over 500 Palestinian communities were forcibly depopulated during the creation of the Israeli state. To mark the occasion, we have re-launched #PalOpenMaps with a bunch of new features
palopenmaps.org/en/
1/6
Palestine Open Maps #PalOpenMaps allows users to search, navigate and download over 330 highly detailed maps of #Palestine before the Nakba, and also to compare past and present geographies
2/6 ImageImageImage
The new version of #PalOpenMaps has added:
- Arabic language
- 1940s aerial photography layer
- Crowd sourced historical map overlay
- Links to local information on other sites
- 3D view
3/6 ImageImageImage
Read 6 tweets
Jan 17, 2023
Want to get #Census2021 data for any area in England and Wales? Wards, parishes, parliamentary constituencies, or perhaps a 1km radius around a local park, school or train station? "Build a custom area profile" is here to help! ons.gov.uk/visualisations…
1/3
Build a custom area profile allows you to:
- find an area on a map + customise it
- select #Census2021 data tables
- save your profile, or even embed it in your website
Read more on our blog!
digitalblog.ons.gov.uk/2023/01/17/cus…
2/3
You can read more about Build a custom area profile, how to use it, and how it works, in this blog post. This is tool is new and a little experimental. Please do share your feedback! (See survey link at bottom of blog post)
surveymonkey.co.uk/r/2SGF6X2
3/3
Read 4 tweets
Nov 2, 2022
🚨 BREAKING 🚨
There's a brand new @Census2021 release this morning with data covering England and Wales right down to a neighbourhood level. You can explore the data using our brand new #CensusMaps tool, but here's a 🧵 with a few highlights...
ons.gov.uk/census/maps
1/9
MEDIAN (AVERAGE) AGE
The oldest local authority in the country on Census day 2021 was North Norfolk (54 years) and the youngest was Tower Hamlets (30 years). At neighbourhood (MSOA) level, average ages ranged from 20 years to 66 years
ons.gov.uk/census/maps/ch…
2/9
MARRIAGE & CIVIL PARTNERSHIPS
There was a huge variation across England and Wales in the proportion people who were married (incl. civil partnerships). The highest % in Wokingham (55.0%) was almost double the lowest in Lambeth (25.6%)
ons.gov.uk/census/maps/ch…
3/9
Read 9 tweets
Oct 31, 2022
In case you didn't get the memo, we've got a big @Census2021 data release coming this Wednesday (2 November) at 9:30am. A quick 🧵 on what to expect...
1/5 It's about us. Census 2021
This next data release will include datasets on the topic of "demography and migration". It is the first of nine topic summary data releases, and is the first @Census2021 release with data down to a neighbourhood level (AKA "output area" level) census.gov.uk/census-2021-re…
2/5 These topic summaries will include: demography and migration
Specifically, you can expect to find data for variables including population density, median age, sex, household size and deprivation, marital status, passports held, and length of residence in the UK
3/5 Age The age of a person on Census Day, 21 March 2021. Age ofLiving arrangements People's living arrangements, by their l
Read 5 tweets
Aug 9, 2021
1/ Ever wondered how your local area has changed over half a century? Today, @ONS is releasing an interactive article covering some of the most interesting changes between 1961 and 2011 England & Wales censuses right down to a local/district level ons.gov.uk/peoplepopulati…
2/ This piece—developed by my colleagues @Annaekhoo (#DataJournalism) and @SamCtrl (#DataViz) from analysis by Amy Boyson (@ONS historical)—has been an opportunity to test some of the techniques we’re hoping to use to explore 100 years of change up to the most recent @Census2021
3/ In particular we've been exploring ways to use historical @OrdnanceSurvey maps painstakingly digitised by @natlibscotmaps as a background for the historical datasets. We hope this #steampunk-esque retro-innovation helps to bring the past to life...
Read 8 tweets
May 17, 2021
1/ Today we published this first of two interactive #scrollytelling pieces focused on economic inequality in the UK, based on measures of income and productivity for each local area. Check it out here... ons.gov.uk/visualisations…
2/ As you'd expect, the analysis found notable economic disparities between southern England and the rest of the UK (the blue map shows relative income, the pink shows relative productivity)... But there were also other notable findings
3/ Importantly, the analysis found some interesting patterns once the two economic measures were overlaid as a #bivariate map, including disparities between cities and their surrounding rural areas (the scatter plot top-right explains the colours)
Read 8 tweets

Did Thread Reader help you today?

Support us! We are indie developers!


This site is made by just two indie developers on a laptop doing marketing, support and development! Read more about the story.

Become a Premium Member ($3/month or $30/year) and get exclusive features!

Become Premium

Don't want to be a Premium member but still want to support us?

Make a small donation by buying us coffee ($5) or help with server cost ($10)

Donate via Paypal

Or Donate anonymously using crypto!

Ethereum

0xfe58350B80634f60Fa6Dc149a72b4DFbc17D341E copy

Bitcoin

3ATGMxNzCUFzxpMCHL5sWSt4DVtS8UqXpi copy

Thank you for your support!

Follow Us!

:(