Ahmad Barclay @bothness.bsky.social Profile picture
Architect // #dataviz storyteller // UX designer. Making sense of census data @ONS. Occasionally #PalOpenMaps. Views my own. Also on 🦣 https://t.co/WlQsSpR0Rp
May 12, 2023 6 tweets 5 min read
Next Monday (15 May) will mark 75 years since the Nakba, when over 500 Palestinian communities were forcibly depopulated during the creation of the Israeli state. To mark the occasion, we have re-launched #PalOpenMaps with a bunch of new features
palopenmaps.org/en/
1/6 Palestine Open Maps #PalOpenMaps allows users to search, navigate and download over 330 highly detailed maps of #Palestine before the Nakba, and also to compare past and present geographies
2/6 ImageImageImage
Jan 17, 2023 4 tweets 4 min read
Want to get #Census2021 data for any area in England and Wales? Wards, parishes, parliamentary constituencies, or perhaps a 1km radius around a local park, school or train station? "Build a custom area profile" is here to help! ons.gov.uk/visualisations…
1/3 Build a custom area profile allows you to:
- find an area on a map + customise it
- select #Census2021 data tables
- save your profile, or even embed it in your website
Read more on our blog!
digitalblog.ons.gov.uk/2023/01/17/cus…
2/3
Nov 2, 2022 9 tweets 8 min read
🚨 BREAKING 🚨
There's a brand new @Census2021 release this morning with data covering England and Wales right down to a neighbourhood level. You can explore the data using our brand new #CensusMaps tool, but here's a 🧵 with a few highlights...
ons.gov.uk/census/maps
1/9 MEDIAN (AVERAGE) AGE
The oldest local authority in the country on Census day 2021 was North Norfolk (54 years) and the youngest was Tower Hamlets (30 years). At neighbourhood (MSOA) level, average ages ranged from 20 years to 66 years
ons.gov.uk/census/maps/ch…
2/9
Oct 31, 2022 5 tweets 4 min read
In case you didn't get the memo, we've got a big @Census2021 data release coming this Wednesday (2 November) at 9:30am. A quick 🧵 on what to expect...
1/5 It's about us. Census 2021 
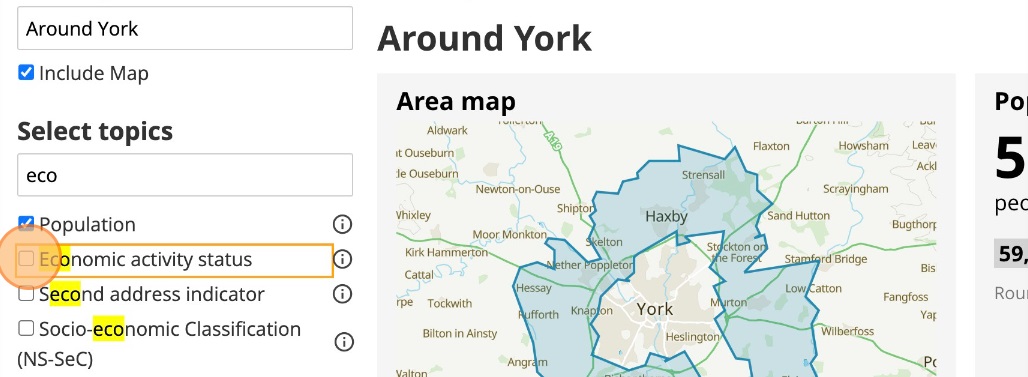
This next data release will include datasets on the topic of "demography and migration". It is the first of nine topic summary data releases, and is the first @Census2021 release with data down to a neighbourhood level (AKA "output area" level) census.gov.uk/census-2021-re…
2/5 These topic summaries will include: demography and migration
Aug 9, 2021 8 tweets 6 min read
1/ Ever wondered how your local area has changed over half a century? Today, @ONS is releasing an interactive article covering some of the most interesting changes between 1961 and 2011 England & Wales censuses right down to a local/district level ons.gov.uk/peoplepopulati… 2/ This piece—developed by my colleagues @Annaekhoo (#DataJournalism) and @SamCtrl (#DataViz) from analysis by Amy Boyson (@ONS historical)—has been an opportunity to test some of the techniques we’re hoping to use to explore 100 years of change up to the most recent @Census2021
May 17, 2021 8 tweets 6 min read
1/ Today we published this first of two interactive #scrollytelling pieces focused on economic inequality in the UK, based on measures of income and productivity for each local area. Check it out here... ons.gov.uk/visualisations… 2/ As you'd expect, the analysis found notable economic disparities between southern England and the rest of the UK (the blue map shows relative income, the pink shows relative productivity)... But there were also other notable findings
May 14, 2021 8 tweets 11 min read
1/ A year ago, @visualizingpal launched #PalestineToday, telling the story of 1,200 historical towns, villages and cities, and highlighting how the #Nakba and the foundation of #Israel in 1948 created the fractured #Palestinian geography that we see today today.visualizingpalestine.org 2/ Looking at the history of the region in this way helps us to put today's events in context. Eg. in "mixed cities" like #Jaffa, #Haifa or #Lydd, where many #Palestinians were forcibly displaced in 1948, and those that remained became an isolated minority today.visualizingpalestine.org/lydda/
Sep 21, 2020 11 tweets 9 min read
1/ Nerdy thread... I recently put together this tool for exploring @ONS statistical geographies & administrative regions for England & Wales. It's one of various prototypes that we're working on in the #DataVis team in thinking how to visualise @Census2021 bothness.github.io/geo-explorer/ 2/ Since joining @ONS a few months ago, I've been trying to make sense of the MANY geographies are used to report data across the UK, from neighbourhood level all the way up to national level, and to be honest it's been a challenge. Here's a list from the 2011 Census...
Apr 23, 2020 6 tweets 7 min read
1/ Hello world! We just made 338 #HistoricMaps of #Palestine available to download in high resolution on Palestine Open Maps #PalOpenMaps. Please do share! palopenmaps.org (a project supported by @visualizingpal @basselkhartabil @creativecommons @mozilla @fabricatorz) 2/ All of the maps are in the public domain (expired copyright), sourced from archives including the David Rumsey map collection, the Israeli and Australian national libraries. The maps are all scanned at resolutions of at least 300dpi. Here's an example of the detail level...
Dec 22, 2019 8 tweets 5 min read
1/ THREAD. I had been planning for a while to visualise the volume of mainstream media coverage on @UKLabour's "antisemitism crisis". Since the @guardian have been central to promoting this narrative (and have a good API) I started scraping their articles to see what I could find 2/ I shelved the idea (for a while) when I realised that just showing the volume of articles mentioning "Labour" + "antisemitism" might simply reinforce existing prejudices. Corbyn supporters would see a media conspiracy. Opponents would see evidence of an actual crisis
Dec 10, 2019 6 tweets 7 min read
1/ Thread... I've decided to spend the day today making charts to remind people of the @Conservatives awful record in government since 2010. Here's the first, on jobs. A decline in wages and a huge increase in zero hours contracts #GE2019 #ToriesOut 
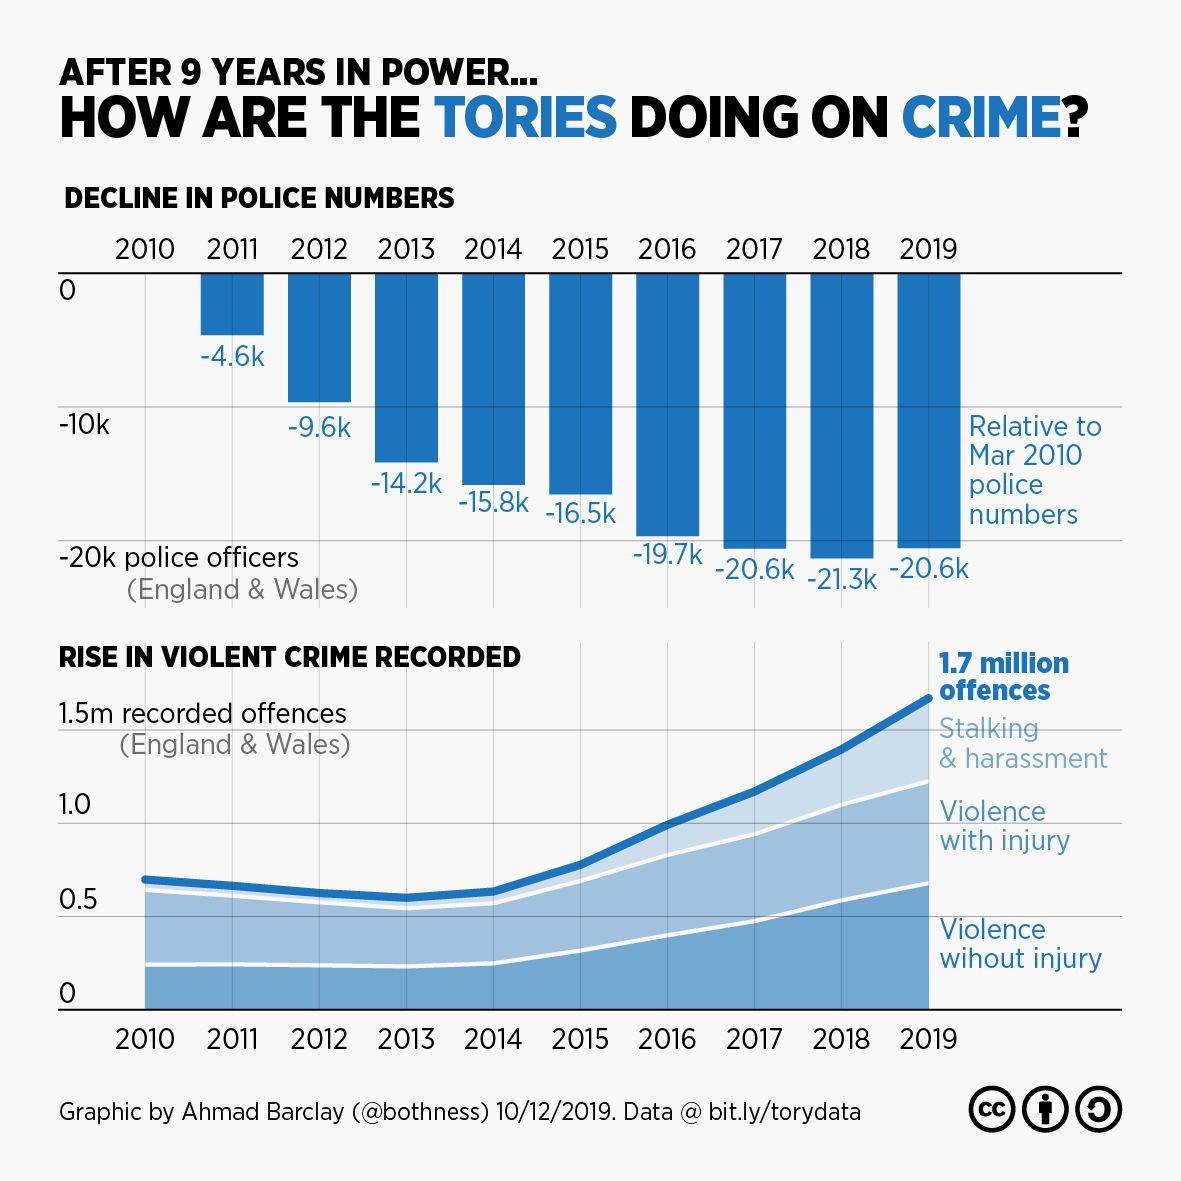
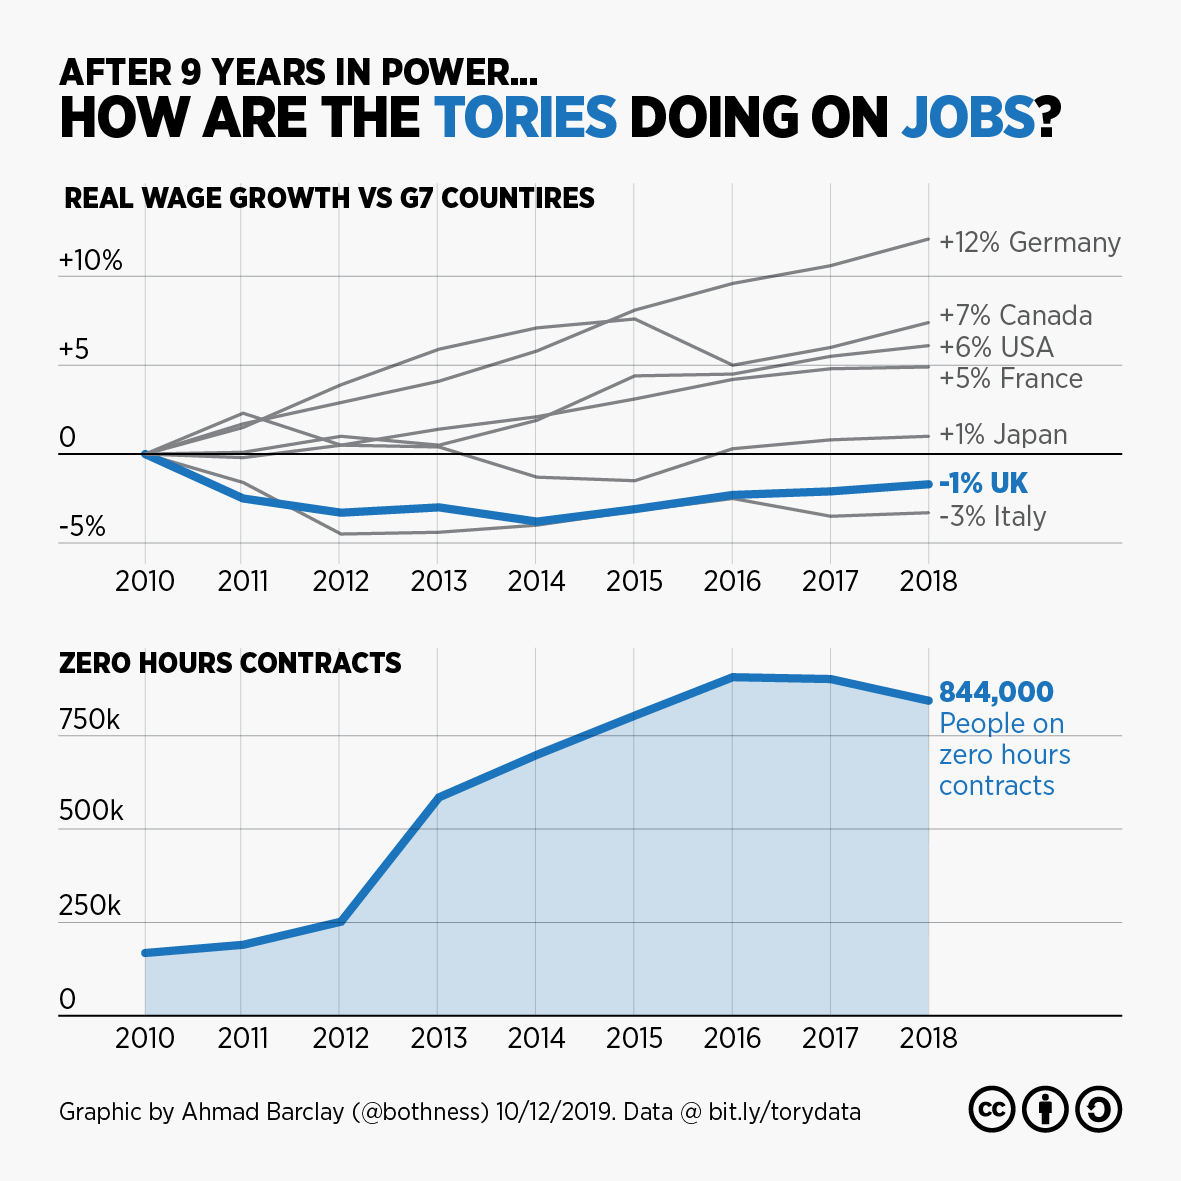
@Conservatives 2/ Here's how the @Conservatives have been doing on crime since 2010. Police numbers falling, recorded violent crime incidents rising #GE2019 #ToriesOut

(Nb. the Crime Survey - an alternative measure - shows a pretty flat trend under Tories after sharp decline from 1995-2010)
Nov 4, 2019 12 tweets 12 min read
1/ I've been following the debate about #TacticalVoting in UK #GeneralElection2019, and particularly the controversy about @BestForBritain's site getvoting.org, which is accused of giving "bogus" advice based on a fairly opaque methodology theguardian.com/politics/2019/… 2/ So... I decided to get the constituency-by-constituency data from this site and a couple of others (tactical.vote & tacticalvote.co.uk) to see how they compare, and whether they pass a basic "plausibility" test based on % voting swing needed from 2017 results