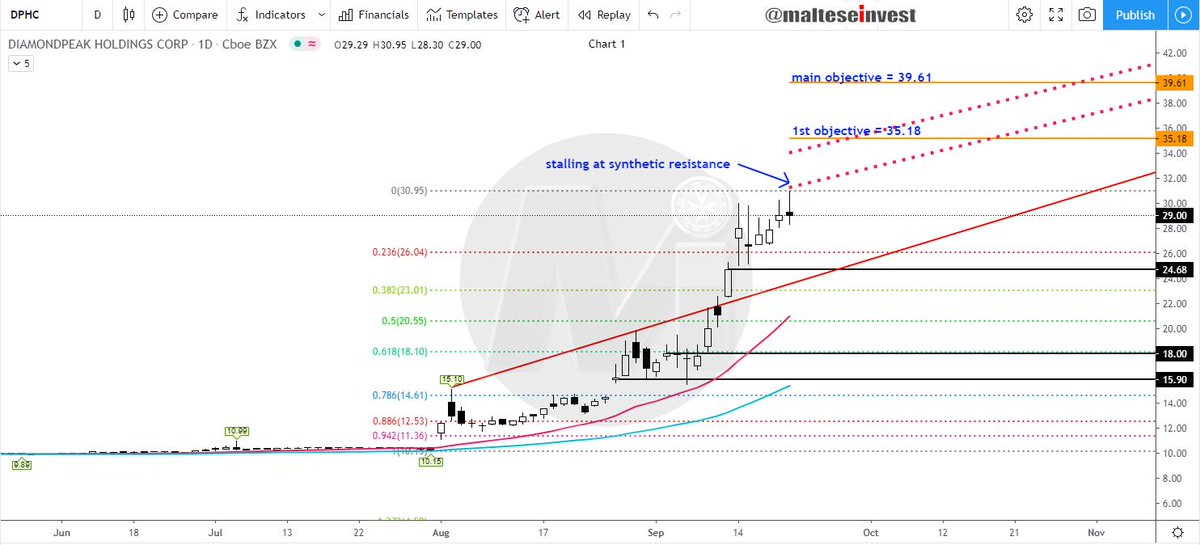
Chart 1
Daily Chart: Price has risen strongly stalling beneath synthetic #resistance at 31.34, moves are overextended and envisage a correction towards 27.90/70. Good #support is seen 26.58- 24.68, and below the .....
DPHC 2/4
..... broken Aug. 2020 #trendline at 23.65. Mild resistance is seen at 35.18/74 and we anticipate a move towards 39.61.
SPHC 3/4
Chart 2
4 Hour Chart: The #SMA 20 has been acting as support since Mar. 2020 and is lining up with the Sept. 2020 #pivot at 24.68. Better supports seen from the #Fibs. 0.50 and 0.618 between 20.55 - 18.10.
DISCLAIMER: The analysis is strictly for educational purposes and should not be construed as an invitation to trade.
SPCE 1/4
Chart 1
Weekly Chart: Nothing has changed since the July analysis - the only additions are the model overlays. Trading remains jammed up, confined to a triangle.
Above the Feb. 2020 #trendline (brown, downward slopping) lies heavy clustered resistances with .....
SPCE 2/4
..... control 40.48. Ideally a close/hold above synthetic #resistance around 42.50 is required.
DISCLAIMER: The analysis is strictly for educational purposes and should not be construed as an invitation to trade.
VISL 1/4
Chart 1
Daily Chart: Appearing to form a base off the ATL @ 0.66. Needs to close above the rising #trendline (above the #SMA 200) then close above the #pivot 3.45.
VISL 2/4
Chart 2
Daily Chart: Formidable #resistance seen at synthetic 5.32/51, a close above for balance @ 7.14. No long term relief unless price closes above 10.10. To the downside, #support begins @ 1.55/45 then .....
DISCLAIMER: The analysis is strictly for educational purposes and should not be construed as an invitation to trade.
SLS 1/4
Chart 1
Weekly Chart: A base has been confirmed and price has spiked up strongly above July 2020 TL and balance @ 11.63 but closed below. A close above is required to target 21.49 then 33.71. .....
SLS 2/4
.... A close/hold above #pivot 38.50 targets the vacuum 50.17 (max. in 2 weeks). Higher up block #resistance 58.51- 84.29 with long term control @ 73.93
DISCLAIMER: The analysis is strictly for educational purposes and should not be construed as an invitation to trade.
RIDE 1/4
Chart 1
Weekly Chart: Dominated by short term traders as the reaction off the November lows has been disappointing - the failure at the #pivot 29.01 and the inability to record a new all time high above 31.80. The chart is now short term #bearish and we await a .....
RIDE 2/4
..... reaction towards 17.25- 15.80 to initiate our position. #Trendline#support and control are in #confluence at 14.48 with the #SMA 200 hovering slightly above. The #resistance zone 25.47- 26.48 is rather fragile.
Chart 1
Daily Chart: The correction lower appears to have based off but there's uncertainty as the reaction has been a little disappointing. Synthetic #resistance is slicing .....
XPEV 2/4
..... the #pivot 57.86, ideally we'd like to see a close above, then take hold of 72.17 and attack the red line.
Chart 1
Weekly Chart: Ever since the break above the Jan. 2019 #pivot 223.83 the rise has been steady and orderly. It is currently running into synthetic resistances sloping at 309.76 and 318.82 with the July 2020 #trendline .....
BABA 2/5
..... #resistance currently at 326.42. #Momentum is positive and rising albeit at a slower pace.