
Nifty Analysis
1. Dow theory considers only closing price
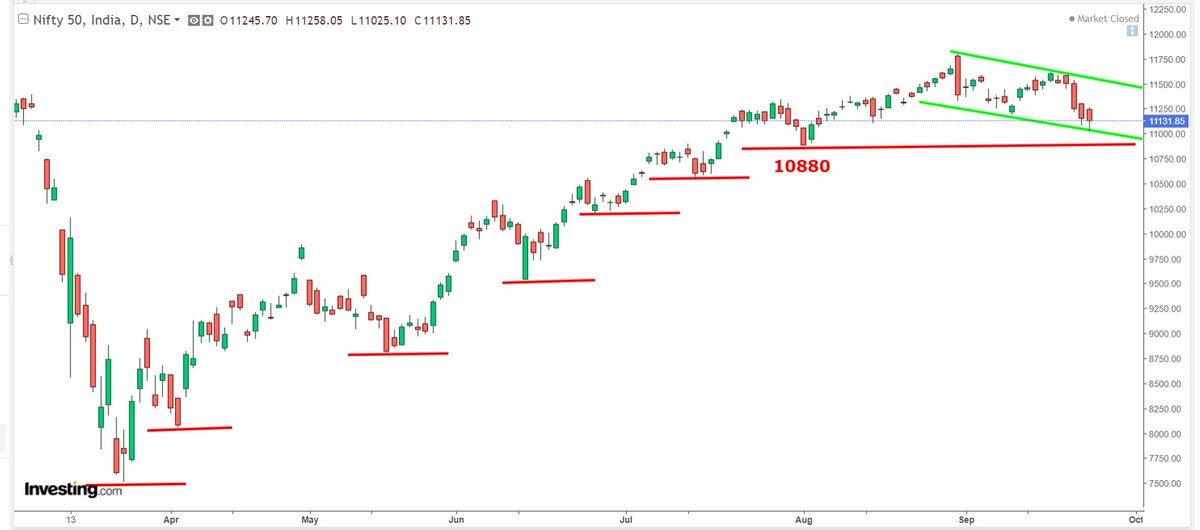
2. Since March 2020 index making Higher top and higher bottom pattern.
3. Last major bottom was at 10880
mini bottoms at 11,110 and 11,185 which were breached in last 2 days. Indicates short term down trend
1. Dow theory considers only closing price
2. Since March 2020 index making Higher top and higher bottom pattern.
3. Last major bottom was at 10880
mini bottoms at 11,110 and 11,185 which were breached in last 2 days. Indicates short term down trend

4. Last top was at 11794 and then at 11618.
Previous bottoms 11,100 and 11185 were broken yesterday as shown by green lines.
5. Till last major bottom 10,880 is not broken, we may not see major downside.
6. Index dint close below 11100 though intraday price went till 11,020+
Previous bottoms 11,100 and 11185 were broken yesterday as shown by green lines.
5. Till last major bottom 10,880 is not broken, we may not see major downside.
6. Index dint close below 11100 though intraday price went till 11,020+

7. As long as price is above 10,880 major bottom it may go into sideways. only a close below 10880 can give more downside targets.
8. After rally from 7500 to 11800 index at times goes into sideways if major bottom is not broken. Break below that confirms medium term down trend
8. After rally from 7500 to 11800 index at times goes into sideways if major bottom is not broken. Break below that confirms medium term down trend

9. It took index 10-11 sessions to go up from 11110 to 11794 where as it took 15-16 sessions to break the previous low 11100. (Not a faster retracement)
10. Fall from 11794 to 11025 is about 18 sessions and 18th session i.e today is a fibonacci day. Possible bottoming day
10. Fall from 11794 to 11025 is about 18 sessions and 18th session i.e today is a fibonacci day. Possible bottoming day

11. 1 technique which i use to pick bottoms is connect previous tops, create a parallel line & then connet to recent low that gives possible bottom.
12. when we connect 11794 &11618, create parallel line, connect that parallel line to 11185, you got todays low 11020 +-10-20pts
12. when we connect 11794 &11618, create parallel line, connect that parallel line to 11185, you got todays low 11020 +-10-20pts
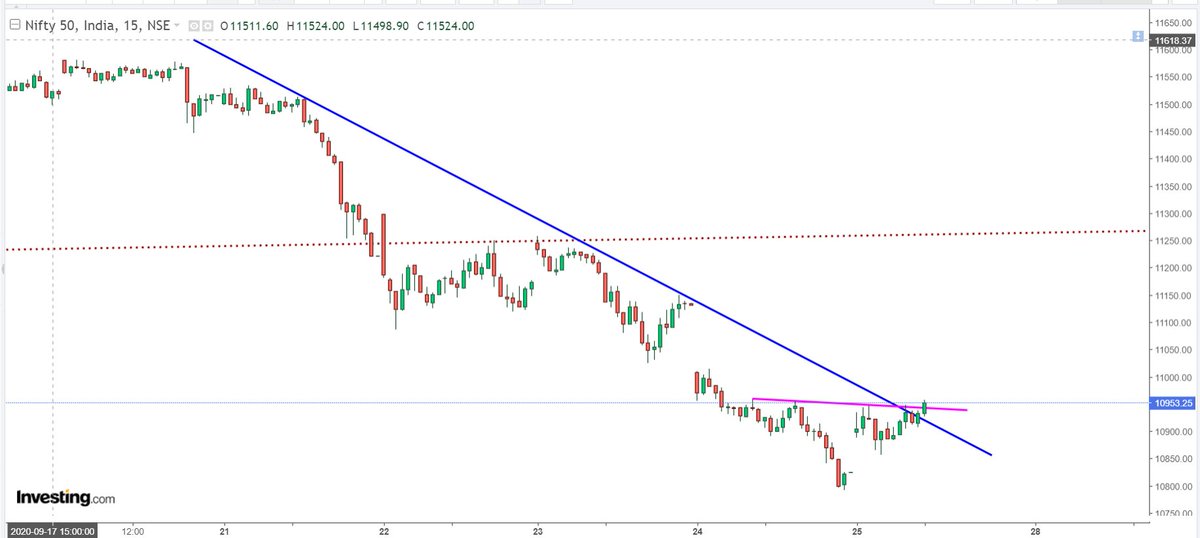
13. As per 60min chart price is inside a paralle downward channel. Can also be called as "FLAG" pattern which is a consolidation pattern as long as it is inside this channel & above major bottom 10880
14. Dotted blue line is trendline connecting last 2 mini bottoms 11110 &11185
14. Dotted blue line is trendline connecting last 2 mini bottoms 11110 &11185

15. To confirm end of medium term uptrend its important to break previous major bottom 10880.
16. Below picture gives clear info.
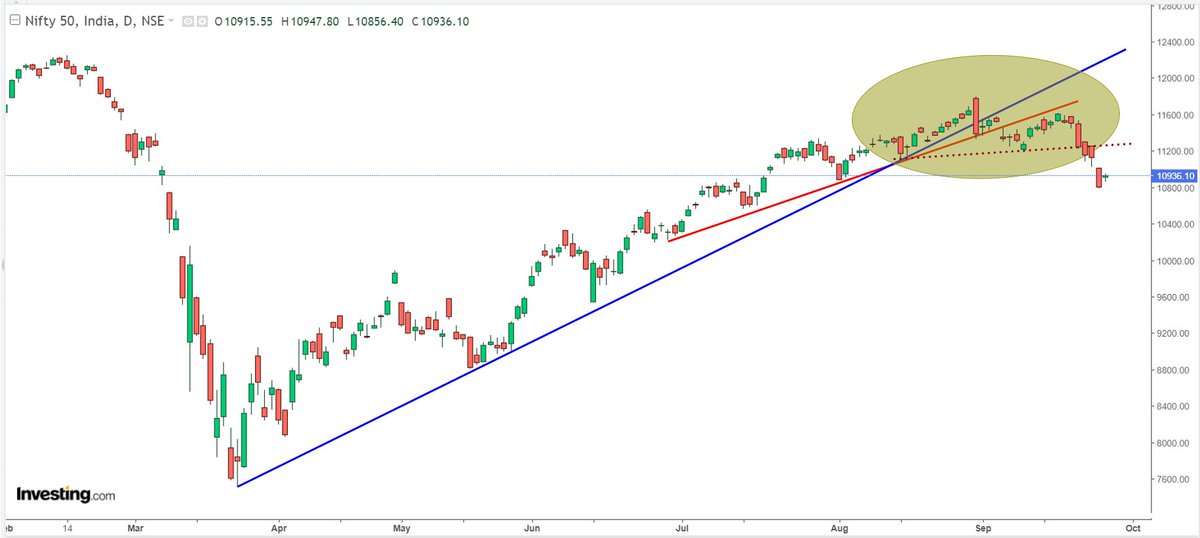
17. Nifty current situation is illustrated by 2nd image denoted by Point A &B. Below10880 signals end of uptrend started from march 2020.
16. Below picture gives clear info.
17. Nifty current situation is illustrated by 2nd image denoted by Point A &B. Below10880 signals end of uptrend started from march 2020.

18. Golden cross(50-200 DEMA) in August 2020, is an indication of stronger uptrend with pull back to retest these EMA at current scenario is a positive signal.
19. 200 DEMA will keep going up with time and is close to last major bottom 10880.
20. Green Channel top is at 11500
19. 200 DEMA will keep going up with time and is close to last major bottom 10880.
20. Green Channel top is at 11500

21. 240min chart indicates formation of hammer, a follow up move above 11250-300 is very important. Close aove these levels confirms short term bottom and look for HH and HL formation.
22. Trend change signal is above 11620, which will also confirm flag/channel breakout.
22. Trend change signal is above 11620, which will also confirm flag/channel breakout.

23. If it is qualified as Flag & Pole pattern then targets are
12000 (Flag target 500pts i.e 11500+500=12000)
12500 (Pole size 1000pts (10800-11800) i.e 11500+1000=12500)
Considering breakout is happening at 11500 above channel
10880 major bottom must hold for this to happen
12000 (Flag target 500pts i.e 11500+500=12000)
12500 (Pole size 1000pts (10800-11800) i.e 11500+1000=12500)
Considering breakout is happening at 11500 above channel
10880 major bottom must hold for this to happen

24. Please do your own research, this is my personal view.
Everyone has their own mind, everyone has opinion.
Please stick to constructive criticism or discussion else please stay away and focus on your work.
Everyone has their own mind, everyone has opinion.
Please stick to constructive criticism or discussion else please stay away and focus on your work.
Tomorrow weekly close, important day. Whether it was a expiry play or genuine break down will be known.
I would like to wait 1 more day.
I would like to wait 1 more day.
Resistance 11250, On hourly chart if index manages to cross 10960-980 then we are headed towards resistance zone.
Since March lows this is the 2nd time index gave 1000pts correction.
1st correction 9800-8800 in May
2nd corretion 11800-10800 in September.
RSI Hit 30 Levels yday.
Todays close is very important and if we hold 10880, cross 11020 in next sessions then index can do 11250
1st correction 9800-8800 in May
2nd corretion 11800-10800 in September.
RSI Hit 30 Levels yday.
Todays close is very important and if we hold 10880, cross 11020 in next sessions then index can do 11250
25. Nify given breakout from falling trendline. Crossing 11020 wil give some strength to move towards 11120-11250.
26. Closing above 11020-11025 is a big positive signal as it will be a complete retracement of yday candle
27. Nifty in tight range 11186-11285, 100Pts can be expected above 11285 towards 11385 and 11400-30 also
28. It's very likely that Nifty might break this range on upside today. 11285 on RADAR
29. Expected breakout on upside above 11285 yday did 11295 intraday and today gap up 110 pts up. Hits high 11365.
30. Consolidation in the range 11600-400 is better for next big move
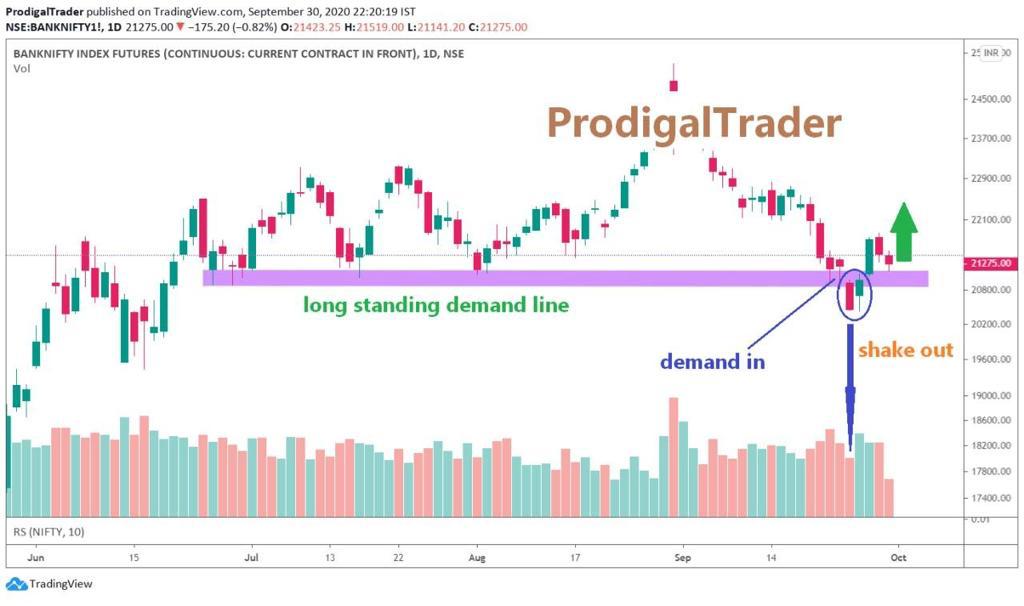
Chart shared by friend. This explains how a shake out/false breakdown in Bank Nifty and Nifty removed all weak hands.
If a breakout or breakdown is on low volume most of the time its weak and can be false.
#learning
If a breakout or breakdown is on low volume most of the time its weak and can be false.
#learning
31. Lets do it 12500-700 😍😍

32. Nifty right now, forming small range
Major support at 11600-650 zone
Major support at 11600-650 zone

33. Nifty facing resistance at 12020-30 support at 11950 +-20pts, above 12020-30 expect 12300

34. Nifty support at 11780-820 band for extreme short term
35. 11780-820 gap area filled
36. Nifty Range 11600-650 on down side and 12050 on upside.
clear 600pts range, above 12050 range target comes at 12600-700 which is also major trendline resistance.
Below 11600 on closing basis is weak for short term.
Keep on eye on these levels
clear 600pts range, above 12050 range target comes at 12600-700 which is also major trendline resistance.
Below 11600 on closing basis is weak for short term.
Keep on eye on these levels
• • •
Missing some Tweet in this thread? You can try to
force a refresh


