Shivaji Vitthalrao🇮🇳 Profile picture
Software Test Manager Ex-ADA Ministry of Defense LCA Tejas, Ex-Honeywell,Ex-HCL Tech,Ex-Bosch Living in Bayern,Germany🇩🇪 https://t.co/V0Vq8IaJ4E
YashwantKumar Profile picture 1 subscribed
Apr 30, 2022 8 tweets 4 min read
#Nifty Vs #DowJones Who will Lead?

As promised here I am posting my analysis in this thread

1. Dow & Nifty 2004 to 2006. Dow Went into sideways consolidation n did 10% move where as Nifty gave a stunning 300% move in this period. Image 2. What was the reason behind Nifty's such a stellar move during 2004-2006? Here is the clue.

Ratio chart gave a breakout in 2004 suggesting outperformance by Nifty against Dow. Index moved from 1300 to 4245,up by 300% whereas Dow remained in Range 9700-11700 during 2004-06 Image
Feb 26, 2021 4 tweets 2 min read
NTPC has potential to test 250-300 or even 400 in next 3-4 years.

13 years of consolidation. CMP 107+

Close above 145-150 will trigger the multi year bull market in this stock.

Stock has given breakout on weekly closing basis.

Disc: Holding the stock from 106 levels Stock No.2

NMDC - 8-9 years of consolidation.

Stock has potential to touch 300 and then 500 levels in 3-4 years.

Close above 140 can trigger that move. CMP 127.

Disc: Holding this stock from 125+ levels
Feb 22, 2021 5 tweets 2 min read
Nifty Sectors

1. Nifty FMCG - Breakdown can test 31850 green line 2. Nifty IT - Below 24300 momentum on downside
Feb 19, 2021 6 tweets 2 min read
1 observation made on Index since feb 2014 which I will reveal to limited people. 😀👍

#Secret 😁😁😉😉

Please do not DM me😀🙏🙏 Nifty Observation

1. Since 2014 all rallies lasted for either 6 or 13 months pattern.

2. Current rally if repeats history expect good correction from 23rd March or 6th April 2021(13th Month)

3. All the rallies retraced 38-50% of previous move in 2-3 months Image
Sep 23, 2020 27 tweets 7 min read
Nifty Analysis

1. Dow theory considers only closing price

2. Since March 2020 index making Higher top and higher bottom pattern.

3. Last major bottom was at 10880
mini bottoms at 11,110 and 11,185 which were breached in last 2 days. Indicates short term down trend Image 
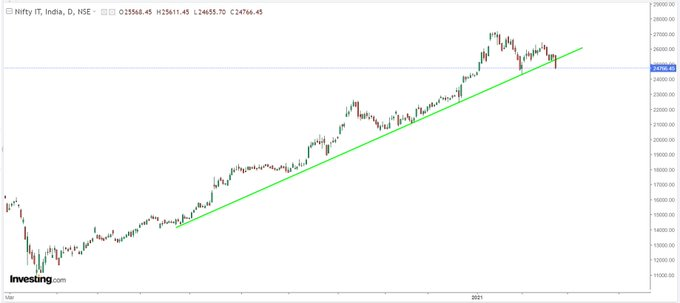
4. Last top was at 11794 and then at 11618.
Previous bottoms 11,100 and 11185 were broken yesterday as shown by green lines.

5. Till last major bottom 10,880 is not broken, we may not see major downside.

6. Index dint close below 11100 though intraday price went till 11,020+ Image