How robust are cross-population signatures of polygenic adaptation in humans?
These selection tests are difficult to get right. My guess is that we will have to wait a few years for trans-ethnic sequence based polygenic models ('GWAS') to get it right.
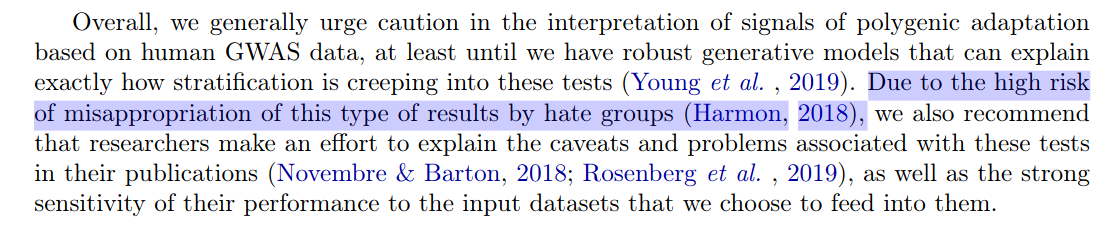
'Beware the hate groups! [proceeds to cite the most important hate group of all, journalists]'
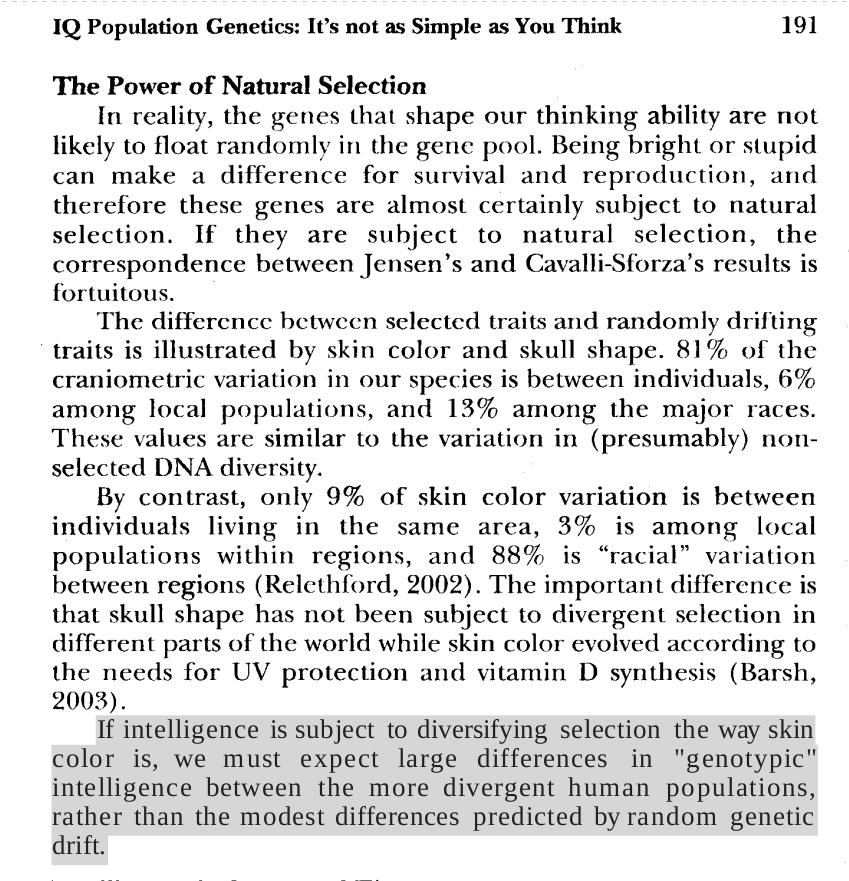
Curiously, did not include the most important trait: intelligence or its social correlates (education, income etc.). Not that I think these conditions would likely reveal much if they can't even find clear evidence for obvious case of height.
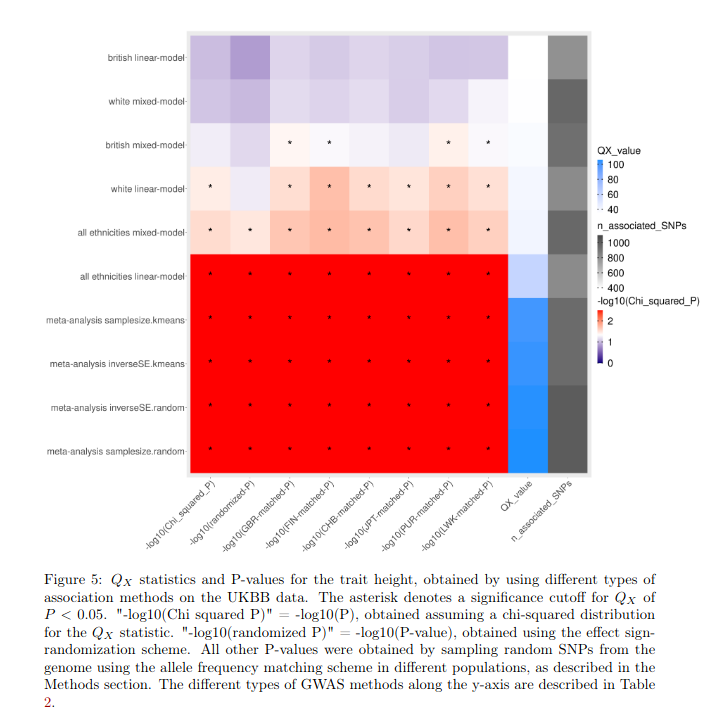
It is very interesting that doing the GWAS on different discovery populations changes the population rank orderings. Considering that the current (European-derived ones) correlate so well with the phenotypes, this is hard to believe.
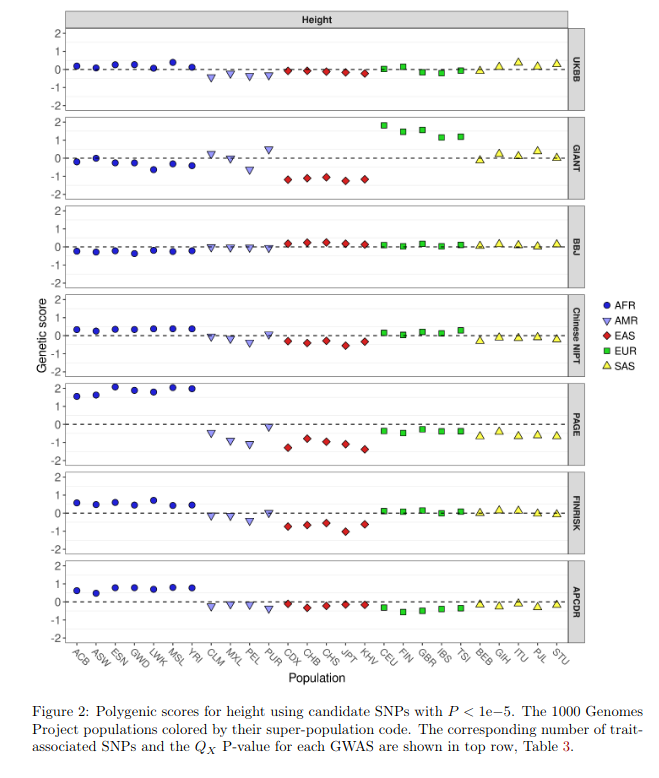
It gets worse. Even within a single dataset, the way to build the genetic model matters a lot for this specific polygenic selection test. It's very brittle in other words.
The results across datasets are quite a lot less damning when one considers the sample sizes are too small to produce much signal. Odd the authors did not take the chance to downsample the larger datasets to match the smaller ones. This could clarify the sample size issue.
The Japanese dataset looks like it contains some outliers, There are some SNPs here with absolute effect sizes > 2! Not mentioned by the authors (I think) but these might obviously cause a big problem.
Overall, this paper is a neat contribution to the debate. We need more of this. I think it also goes to show the extreme potential for method hacking results of interest in this research space. Way too many decisions to make and large effects on results!
• • •
Missing some Tweet in this thread? You can try to
force a refresh
"GRAF-pop correctly determined populations for more than 98% of European and 97% of Asian and African American subjects. The prediction accuracy for South Asian subjects is also greater than 98%, but the number of subjects is small."
"We used genotype data of 2,504 individuals from 1000 Genomes as a test for GRAF-pop. For HapMap defined “super populations” EUR, AFR, EAS, SAS, the accuracies are greater than 99%"
"The super population AFR includes two admixed populations from Americas: ASW (Americans of African ancestry) and ACB (African Caribbeans). If we exclude these two populations from AFR, then the prediction precision of GRAF-pop in non-admixed continental populations is 100%."
"Armed with this learning “Rosetta Stone,” we revisit various well-known results, showing, inter alia, that learning differences between most- and least-developed countries are larger than existing estimates suggest."
So, it's another item linking study. The idea is to find items that have been reused across these tests, and thus one can link the scores with some math tricks. Coverage looks like this.
The results look pretty much like every other such ranking.
Tracking intelligence's evolution over time from genomes of fossils? Check!
On divergent selection, also confirmed in modern studies.
Variants associated with intelligence show more variation than random ones, or even matched ones (e.g. on MAF in discovery population, or derived-status).
So there is a new Dunning-Kruger paper out by Gignac and Zajenkowski. It goes like this:
Dunning Kruger pattern is trivial given 1) people overestimate themselves, and 2) self-estimate x criterion value is r < 1.00. I agree, I wrote that years ago.
So they collect some new data, typical weird format students self-rating and Raven's test. Looks like the usual deal.
A nice twist is that they realize the DK claim is a test for heteroscedasticity (what? inconstant variance). Well, I recently spent a lot of time thinking about this and they posted their data on OSF, so all is good, time for re-analysis!
Alright, big RCT time! Denmark did a big RCT on some preschool intervention in 2015. n=5436. We set a reminder to wait for their follow-up. That's now.
So, their test scores on verbal skills went up immediately after intervention ended.
And then, as you saw, there was NO MAIN EFFECT in follow-up! 😨
Not to worry though! Researchers then found a subgroup with p < .05. 😌 Kids with parents "without college" (defined via <14 years of education) had d = 0.26 improvement.
Did they do a formal interaction test or the subgroup fallacy? It seems it's the latter. Their p values in this subgroup is not even p < .01 despite n=597 kids.