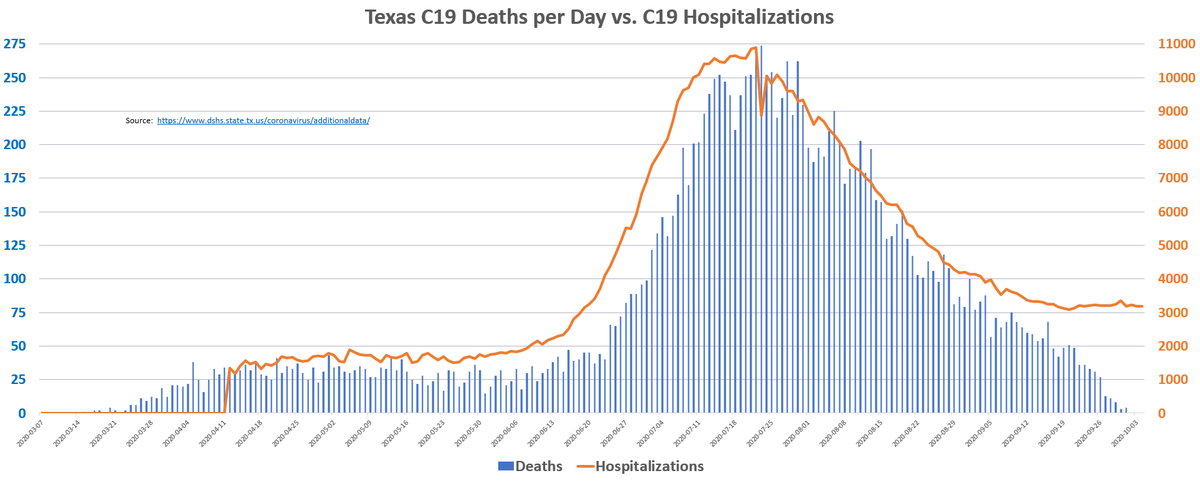
Back to Texas this afternoon, if you missed @EthicalSkeptic great analysis of Texas last night, I've included it below. Nice to see my assertions confirmed by the great TES! In this thread I'll do my usual breakdown of Hospitalizations vs fatalities, both DoD and DoR.
TX Fatalities by Date of Death vs Hospitalizations- 10/4
* Fatalities peak on 7/23
* Hospital census false floor of ~3200 beds ~5% of capacity
* TES highlighted LTC as partial reason for this
* Otherwise my assertions linked below were TES confirmed
* 202 Fatalities reported the past 3 days
* Down 20.8% from the same 3 day period LW (255)
* 56 Dates Revised past 3 days
* 38 > 4 weeks old
* 25 > 6 weeks old
* 13 > 8 weeks old
* Not as good as 10/1, but still less DC laundering than we saw in Sept
Reported fatality 7D average (Not DoD) declined by 7 over the past 3 days to 72.
* Lowest since July 11
* Down 67.4% since August 17
* Down 74.5% since August 1 peak
4/end
• • •
Missing some Tweet in this thread? You can try to
force a refresh
* Census - 3251 - up 44 beds Week over Week (WoW)
* Census Down 70.2% since 7/22 Peak
* % Beds used by C19 - 5.86%
* ICU C19 - 1044, down 22 WoW
* Hospital commentary, leading Indicators analysis next
* ICU continues to decline as % of total C19
* 9/29 - 32.11%
* 9/22 - 33.21%
* 9/15 - 34.76%
* False floor
** Delayed care patients - nosocomial
** PCR Ct functional false positives
** Cares Act $ putting pressure to code as C19
3/n - Case & Pos% Commentary
* Test Positivity Rate is at lowest point since MAY 26.
* 2nd chart - New reported cases have declined substantially the last 5 days.
* 7D average of new cases is 2872, lowest since June 19
TX Fatalities by Date of Death vs Hospitalizations - 9/30
* Fatalities peaked on 7/23
* Hospital census has hit false floor ~3200 beds ~ 5% of capacity
* Reported fatalities continue to drop
* Reducing frequency on this report
* 337 Fatalities reported the past 5 days
* Down 16.6% from the same 5 day period LW (404)
* 73 Dates Revised in that period
* 81 > 4 weeks old
* 47 > 6 weeks old
* 28 > 8 weeks old
* That is just nuts. Still waiting on @TexasDSHS@GovAbbott to explain
2/n
3/end
Interesting to see the progression of fatalities since the beginning of this:
102: March
887: April
925: May
1333: June
6569: July
4592: Aug
1197: Sept
Obviously lots of DC laundering going. July, especially August will get some added. Sept likely ends up ~1800
* They track historical pos%
* A test run w/ high pos% = red flag
* Low CT positive = infectious
* They have a CT cutoff - I guarantee its not 40
* Tests w/ high CT (~30) = red flag, stop, do a retest regime
I should correct myself here and say > 34 cycles = not infectious, not transmittable. No live culture after 34 cycles. Its a remnant of past exposure, almost a AB test at that point. That is detailed in the article.
TX Fatalities by Date of Death vs Hospitalizations - 9/24
* Fatalities peaked on 7/23
* Hospital census Up 9 to 3204
* 138 reported fatalities up from from last week's 112
* DoD report next
* Analysis on which counties these are coming from next as well
* 47 Dates Revised
* 28 > 4 weeks old
* 17 > 6 weeks old
@GovAbbott@TexasDSHS@HoustonHealth
24% of these are prior to 9/1. This is day after day after day. When is the state going to explain this to its citizens?
2/n
3/n
Surprise! Tiny Border counties (in green) all over the Top 19. Hidalgo leading the state.
My last border report will be in 4/n. 9% of Tx population with nearly 25% of the fatalities. @GovAbbott - looks like this issue has still not been discussed or addressed.
* Down 42 beds Week over Week (WoW)
* Census - 3204 - up 9 from 9/23
* % Beds used by C19 - down to 5.51%
* ICU C19 - 1051, down 89 WoW
* Leading Indicators analysis next
* Note that ICU, 1/3 of total, declined by 89 WoW, while general down 42 WoW. Reduction in severe cases.
* Appears there is a false floor building
** Delayed care patients?
** Mass PCR Testing
** PCR Ct issues
** Diagnosed With, and not Of?
3/n - Case & Pos% Commentary
Test Positivity Rate (Yellow Line) is at lowest point since 6/2. Thankfully we don't use the green line that was obfuscated by Pending Assignments and was a total mess.
2nd chart - New reported cases have flattened around 3150 per day (new system)