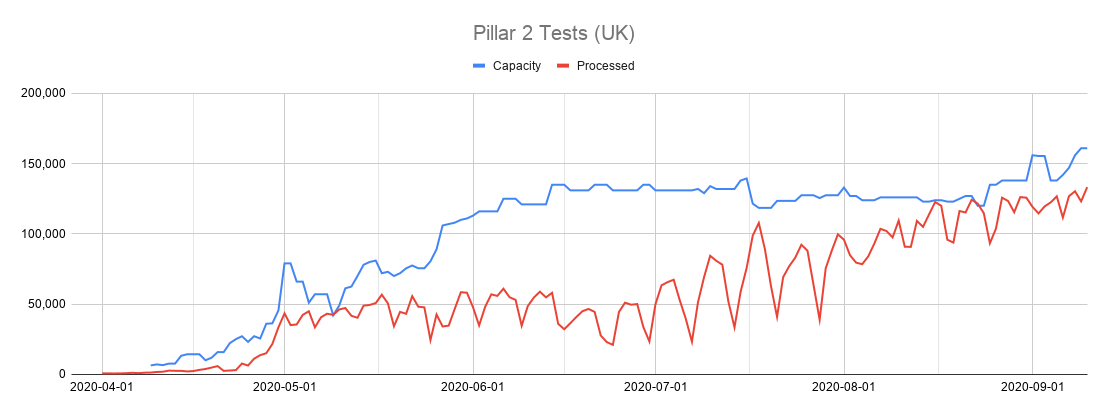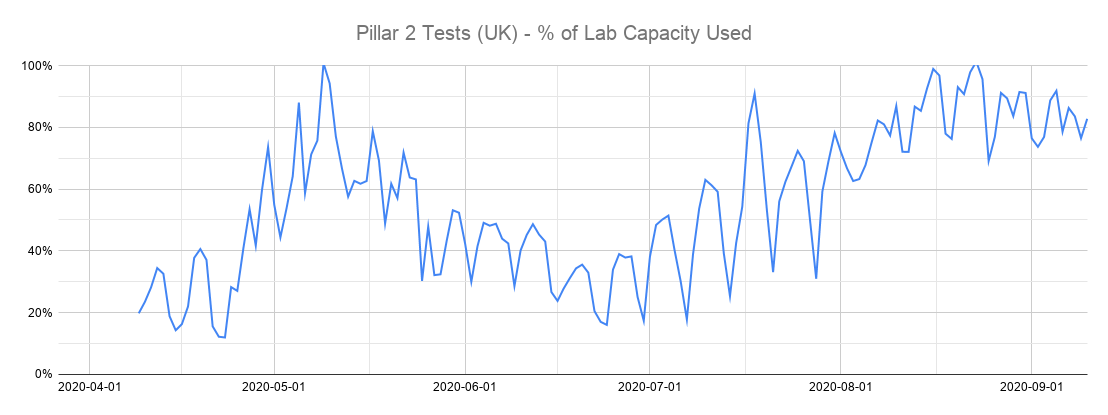
Some people still seem convinced the recent surge in covid-19 cases is caused by "false positives" (people who don't have the virus but still test positive due to various issues), often claiming 90% of reported cases aren't real.
This argument doesn't hold water.
Here's why...
This argument doesn't hold water.
Here's why...
A lot of this goes back to a quote from Matt Hancock that the false positive rate was "under 1%".
Some assumed the rate was close to 1%, which would mean if you test 200,000 people a day who (mostly) don't have the virus, you'd get 2,000 false positives.
Some assumed the rate was close to 1%, which would mean if you test 200,000 people a day who (mostly) don't have the virus, you'd get 2,000 false positives.
https://twitter.com/JuliaHB1/status/1306916494773755910?s=19
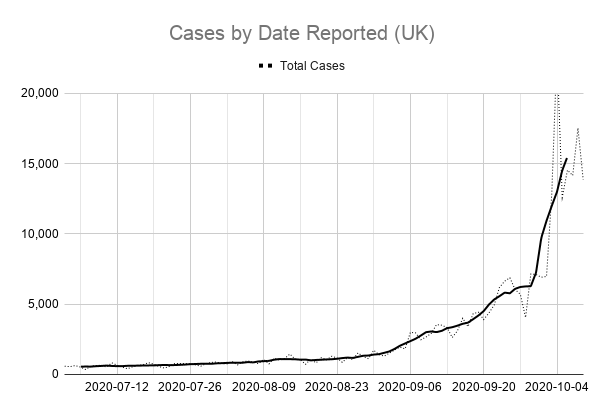
The first problem with this argument is the number of cases went up faster than the number of tests done.
That means the % of tests coming back positive went up.
But the % of tests giving a false positive shouldn't have changed.
So the % of true positives MUST have gone up.
That means the % of tests coming back positive went up.
But the % of tests giving a false positive shouldn't have changed.
So the % of true positives MUST have gone up.
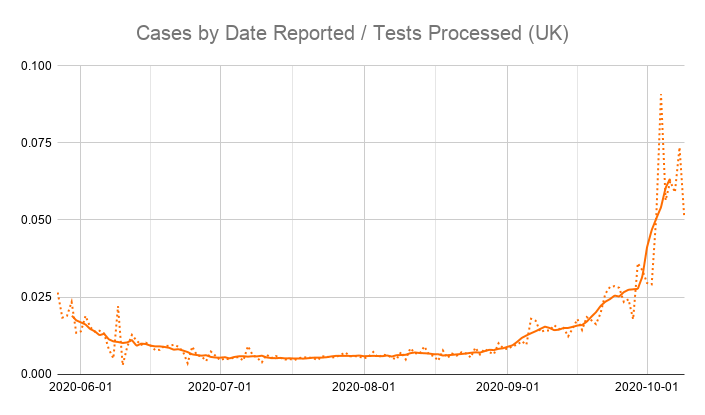
On September 1st 1,295 positives were reported from 158,554 tests.
IF the false positive rate (FPR) was 0.8%, ALL of those could be false!
BUT on October 8th we got 17,540 positives from 238,461 tests.
A 0.8% FPR would only give 1,908 false positives, leaving 15,632 real ones.
IF the false positive rate (FPR) was 0.8%, ALL of those could be false!
BUT on October 8th we got 17,540 positives from 238,461 tests.
A 0.8% FPR would only give 1,908 false positives, leaving 15,632 real ones.

The second problem is the FPR seems to be a LOT less than 1%.
Even if you assume that ALL the positives on a given day are false, the FPR can't be higher than the % of tests that came back positive when the virus was at its lowest level.
So what's the highest it could be?
Even if you assume that ALL the positives on a given day are false, the FPR can't be higher than the % of tests that came back positive when the virus was at its lowest level.
So what's the highest it could be?
At the low point of the virus in early summer, the ONS infection survey only got 50 positives from 112,776 swab tests over a 6 week period.
That implies the FPR can't be more than 0.044%, or they would have got more than 50 just from false positives.
ons.gov.uk/peoplepopulati…
That implies the FPR can't be more than 0.044%, or they would have got more than 50 just from false positives.
ons.gov.uk/peoplepopulati…
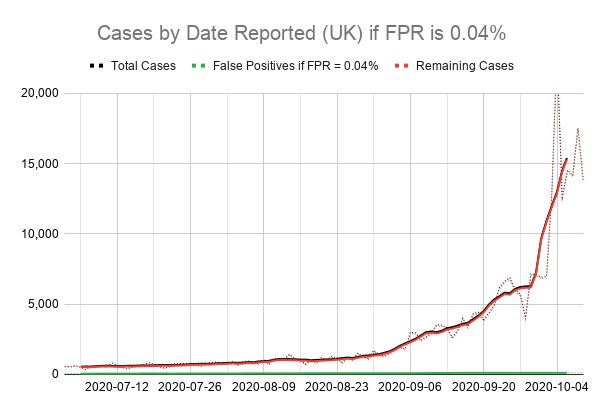
So going back to September 1st, when we did 158,554 tests, if the FPR can't be higher than 0.044%, at most 70 of the 1,295 cases that day could have been false positives.
And on October 8th, when we did 238,461 tests, at most 105 of the 17,540 positive results were false!
And on October 8th, when we did 238,461 tests, at most 105 of the 17,540 positive results were false!
Ah, but what about overly sensitive tests picking up the remnants of old infections?
Well, it's a valid point academically that not all positive tests are equal, but again it can't explain the recent surge in cases.
google.com/amp/s/www.bbc.…
Well, it's a valid point academically that not all positive tests are equal, but again it can't explain the recent surge in cases.
google.com/amp/s/www.bbc.…
The virus peaked in April and we've been doing a fair amount of testing since May.
Even if you can test positive 2-3 months after infection, why would we see a surge in old infections being picked up now, 2-3 months after the virus was at its LOWEST level? 🤔
It makes no sense.
Even if you can test positive 2-3 months after infection, why would we see a surge in old infections being picked up now, 2-3 months after the virus was at its LOWEST level? 🤔
It makes no sense.
It also doesn't explain why cases rose sharply in care homes recently, where most people being tested now have been tested at least once before in the last 3 months, some of them weekly.
These shouldn't be old infections only being picked up now.
google.com/amp/s/amp.theg…
These shouldn't be old infections only being picked up now.
google.com/amp/s/amp.theg…
In fact the only reason "old positives" was ever raised is because cases were going up but deaths weren't.
But we know there's a lag between cases and deaths. And sadly now that rise in cases is being reflected in rising hospitalisations and deaths.
There's no mystery to solve.
But we know there's a lag between cases and deaths. And sadly now that rise in cases is being reflected in rising hospitalisations and deaths.
There's no mystery to solve.
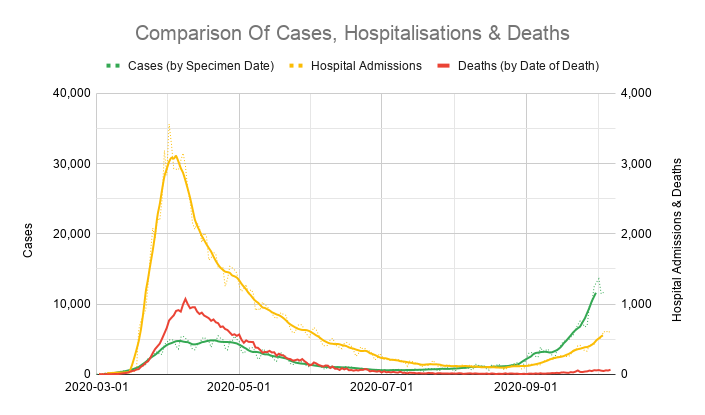
So the whole premise that cases are rising but deaths aren't is no longer true.
Remants of old infections being picked up shouldn't be a significant issue anymore, if it ever was.
And the false positive rate is negligible, probably giving no more than 100 false positives a day.
Remants of old infections being picked up shouldn't be a significant issue anymore, if it ever was.
And the false positive rate is negligible, probably giving no more than 100 false positives a day.
• • •
Missing some Tweet in this thread? You can try to
force a refresh


