To help improve load times and usability, I've split the UK page up into three separate pages, and added some additional stuff to them!
The first is the 'national' page. This includes the UK wide data, 4 nation data, large UK regional data, and international comparisons.
The first is the 'national' page. This includes the UK wide data, 4 nation data, large UK regional data, and international comparisons.

On here I added in per capita figures into the English cases by day chart, and I also added a deaths version of the same chart.
Although I've only just started collecting the data for that, so it's just overall totals until later on today, when I can show the daily increase.

Although I've only just started collecting the data for that, so it's just overall totals until later on today, when I can show the daily increase.


The second one is the 'local' page! This now has a time series of cases by day in each local authority (since I started collecting it in July at least), and a quick search box to see some data about a specific local authority 

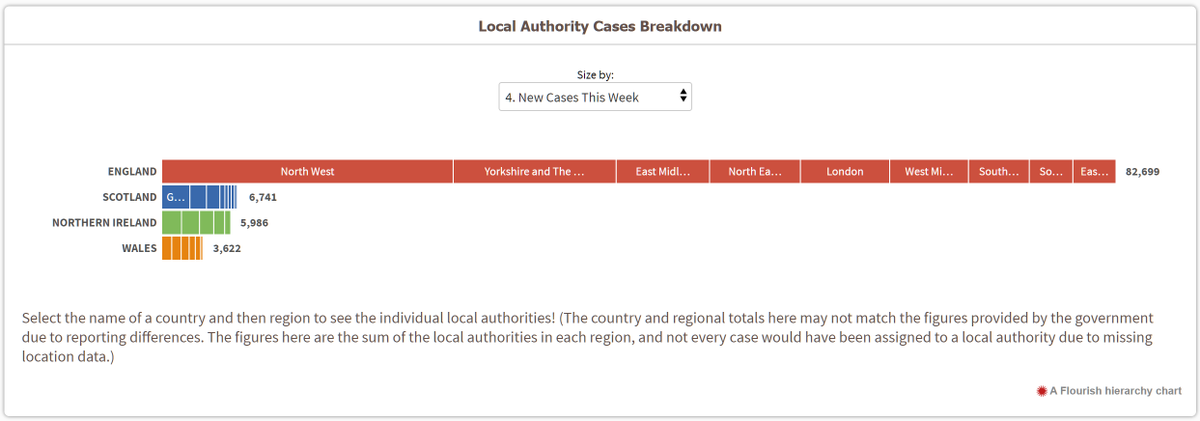
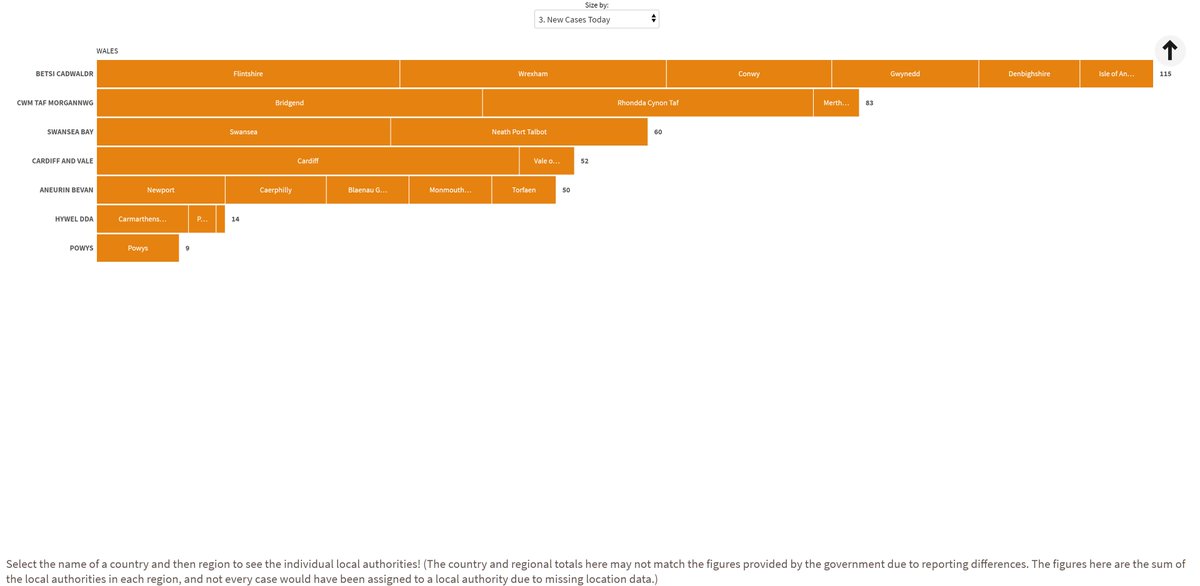
There's also this chart, similar to the one on the Scotland page, where you can dive into regions and see the local authorities within them that way 


And the final one is the 'additional death data' page. This includes all the ONS/NRS/NISRA weekly death data and the excess death data
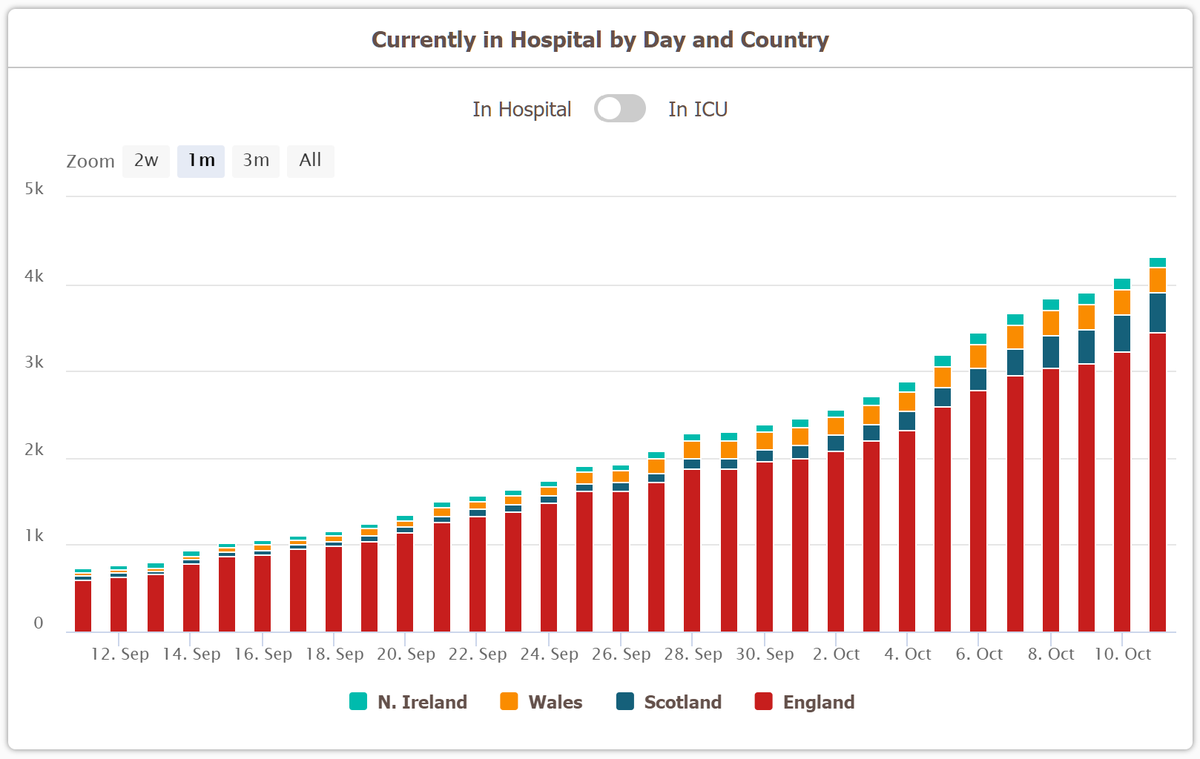
To avoid confusion I'm only going to show the 'confirmed' deaths on the other two pages, and leave the other death counts for this page
To avoid confusion I'm only going to show the 'confirmed' deaths on the other two pages, and leave the other death counts for this page

It has these local authority maps similar to the local data page. One showing total deaths per capita, and the other showing the number of new deaths reported in the latest week 


I expanded the old 'alternative death counts' table to include all the large English regions too
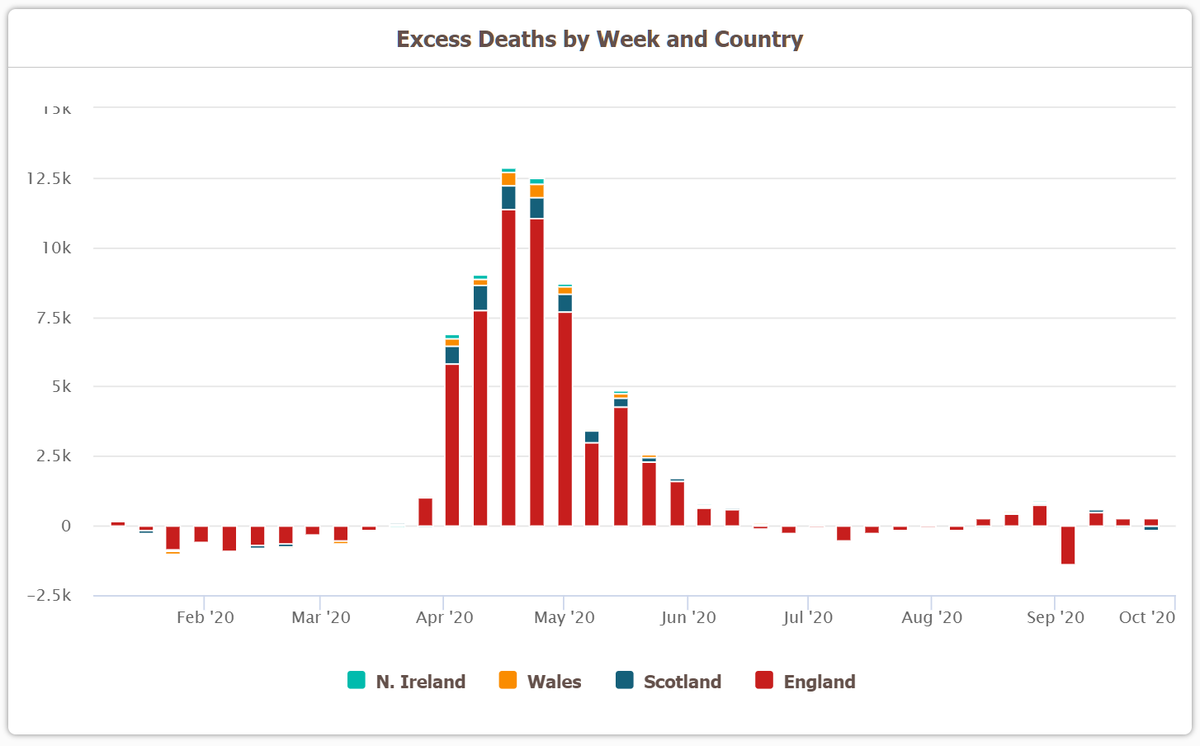
And there's now an excess deaths by week chart which you can filter by country
This page will only be updated once a week on Tuesday


And there's now an excess deaths by week chart which you can filter by country
This page will only be updated once a week on Tuesday


That is all! Let me know if you've got any other suggestions or spot any issues 😊
I plan on making similar changes to the Scotland page over the next couple of days
I plan on making similar changes to the Scotland page over the next couple of days
• • •
Missing some Tweet in this thread? You can try to
force a refresh


