In the USA, for those under age 45, lockdown deaths exceed Covid deaths by nearly 2:1, through the end of August.
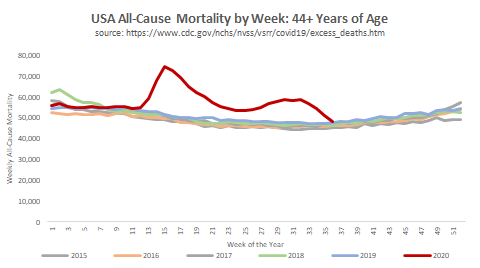
For those aged 45-74, lockdown deaths account for 23% of net Excess mortality; mortality displacement explains (at minimum) a further 24%.
For those older than 75, mortality displacement drove 26% of excess mortality and lockdowns drove a further 18%.
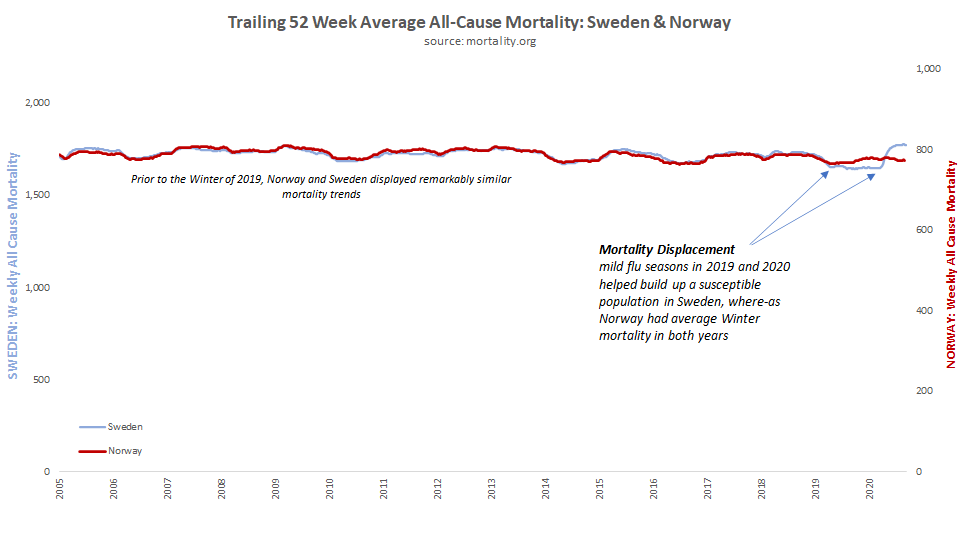
For the USA, Covid is a real disease that really kills a vulnerable population and the USA happens to have a large vulnerable population, partially due to mild flu seasons in 2019 and 2020. But, lockdowns also kill people - even young people.

• • •

Missing some Tweet in this thread? You can try to force a refresh
 

Keep Current with PLC

PLC Profile picture

Stay in touch and get notified when new unrolls are available from this author!

Read all threads

This Thread may be Removed Anytime!

PDF

Twitter may remove this content at anytime! Save it as PDF for later use!

Try unrolling a thread yourself!

how to unroll video
  1. Follow @ThreadReaderApp to mention us!

  2. From a Twitter thread mention us with a keyword "unroll"
@threadreaderapp unroll

Practice here first or read more on our help page!

More from @Humble_Analysis

12 Oct
Why are so many elderly dying of Covid? Mostly because those are the people who die, of any cause. Past age 45, Covid share of total deaths is fairly constant. Under 45, Covid mortality is vanishingly rare:
Across all age groups, Covid is rapidly disappearing as significant cause of mortality in the USA. This could be both because Covid deaths are declining and because lockdown-induced mortality remains high.
For those under 15, the risk of dying with Covid are literally 1 in a million while almost 1% of the 85+ group has died with Covid. To put that in perspective, 11% of those over 85 have already died this year, from any cause.
Read 4 tweets
3 Oct
The countries of Southeast Asia have reported essentially zero Covid-related deaths with many theories posited regarding the source of this surprising "immunity", but newly shared mortality data from S. Korea may have solved this mystery.
The Human Mortality database, a collaboration of UC Berkeley and the Max Planck Institute in Germany have recently added South Korea weekly mortality data back to 2010 which supports the "dry tinder" or mortality displacement hypothesis: Image
After a long period of remarkable consistency, South Korea has had three straight bad "flu seasons", with 2018 being especially bad. Unlike Europe and the Americas, 2018 was not followed by mild years but by two more bad years: Image
Read 7 tweets
2 Oct
The divergent outcomes between regions of the world is the single defining characteristic of Covid-19. For 75% of the world's population, there has been no pandemic. Even within Europe and the US, the regional variations are immense.
Just 20 nations account for 75% of total reported Covid deaths, all in W. Europe, S. America (+USA). In fact, for 85% of the world, there has been no pandemic. The impact appears entirely regional and government policy seems to have made no difference. So, what explains this?
Potential drivers of these results include: obesity rates, aged population, BCG vaccines, prior coronavirus exposure, vitamin D deficiency, nursing home policies, ventilator use, hospital access, lockdown severity. Likely all of these are necessary but not sufficient.
Read 5 tweets
1 Oct
There are a group of 13 states where all-cause mortality trends almost perfectly mirror those seem in euromomo.eu for Western Europe. In these states, the Covid pandemic ended almost twenty weeks ago: Image
Another group of states saw a wave of excess mortality in the Summer, but at a much less significant scale. For these states, it appears that the pandemic is currently winding down and deaths are returning to normal: Image
A third category(including CA) has seen either two moderate waves or a sustained mild uptick in mortality. These states also appear to be returning to normal, but they may continue trending with somehow higher than normal deaths: Image
Read 6 tweets
18 Sep
Norway is claiming that flu deaths don't explain their lower Covid mortality compared to Sweden.

thelocal.no/20200917/norwa…
At first glance, it does appear that Sweden and Noway followed very similar trends until Covid emerged around week 11 of 2020: Image
Looking at a 52 week rolling average indicates that the divergence between Norway and Sweden actually began around week 40 of 2018 - essentially, Norway had two normal Winters while Sweden had two consecutive mild Winters: Image
Read 4 tweets
16 Sep
The CDC has updated their weekly excess mortality report, which now indicates that all-cause mortality returned to the normal or expected level at the end of August:
In total, there have been 232K more deaths than expected this year, while the CDC currently reports 182K Covid deaths. This 50K person gap can be explained by reporting lags, undercounts, or lockdown-induced deaths.
For those over 45, the all-cause mortality curve mirrors Covid mortality - implying that most of this excess mortality will be attributed to Covid (or Covid panic):
Read 7 tweets

Did Thread Reader help you today?

Support us! We are indie developers!


This site is made by just two indie developers on a laptop doing marketing, support and development! Read more about the story.

Become a Premium Member ($3/month or $30/year) and get exclusive features!

Become Premium

Too expensive? Make a small donation by buying us coffee ($5) or help with server cost ($10)

Donate via Paypal Become our Patreon

Thank you for your support!

Follow Us on Twitter!