
Ct values can be used to estimate epidemic dynamics! We show that the distribution of viral loads changes during an epidemic and develop a new method to infer growth rates from cross-sectional virological surveys without using reported case counts.
1/25
medrxiv.org/content/10.110…
1/25
medrxiv.org/content/10.110…
Highlights:
- The distribution of observed viral loads is determined by recent incidence trends
- The median and skew of detectable Cts in Massachusetts were correlated with R(t), as predicted
- A novel statistical method to infer the epidemic growth rates using Ct values
2/25
- The distribution of observed viral loads is determined by recent incidence trends
- The median and skew of detectable Cts in Massachusetts were correlated with R(t), as predicted
- A novel statistical method to infer the epidemic growth rates using Ct values
2/25
Cts are inversely proportional to log viral loads. The relationship depends on the instrument and sampling variation, but low Cts generally indicate high viral loads. Think about expectations & distributions rather than individual measurements
academic.oup.com/cid/advance-ar…
3/25
academic.oup.com/cid/advance-ar…
3/25
In acute infections, viral loads generally follow a consistent (but noisy) trajectory. We aren't certain of the full trajectory, but we know that i) viral growth is faster than decline and ii) people can persist at low viral loads for a long time.
4/25
https://twitter.com/DiseaseEcology/status/1312537935892246528?s=20
4/25
So, a high viral load likely indicates recent infection, whereas a low viral load is *more likely* (note, not guaranteed) to indicate an older infection.
5/25
5/25
OK… where am I going with this? Well, it’s been noted a few times that the distribution of Ct values has changed over the course of the pandemic, eg:
medrxiv.org/content/10.110…
How puzzling!
6/25
medrxiv.org/content/10.110…
How puzzling!
6/25
One way this can arise is through biased sampling eg. if we mostly sample people soon after symptom onset then we’ll see low Cts, whereas if we sample people after they’ve recovered, we’ll see higher Cts. But if we sample people at random, this shouldn’t matter.
7/25
7/25
Then why have Ct values changed? It’s because of *epidemic dynamics*! Imagine we sampled a bunch of infected people today. If we knew when those people got infected, we’d notice that (8/25):
1. If the epidemic is growing, people were typically infected more recently. If the epidemic is declining, people were typically infected further in the past. The distribution of *times since infection* depends on the incidence of infections.
9/25
9/25

2. The time since infection dictates observed viral loads. People who were infected a long time ago typically have lower viral loads, because the decline phase of viral kinetics takes longer that the growth phase (remember – expectations not individuals!).
10/25
10/25

3. So the distribution of viral loads sampled today depends on the distribution of times since infection, which in turn depends on the epidemic growth rate. Therefore, with appropriate calibration, the distribution of observed Ct values is informative of epidemic dynamics.
11/25
11/25
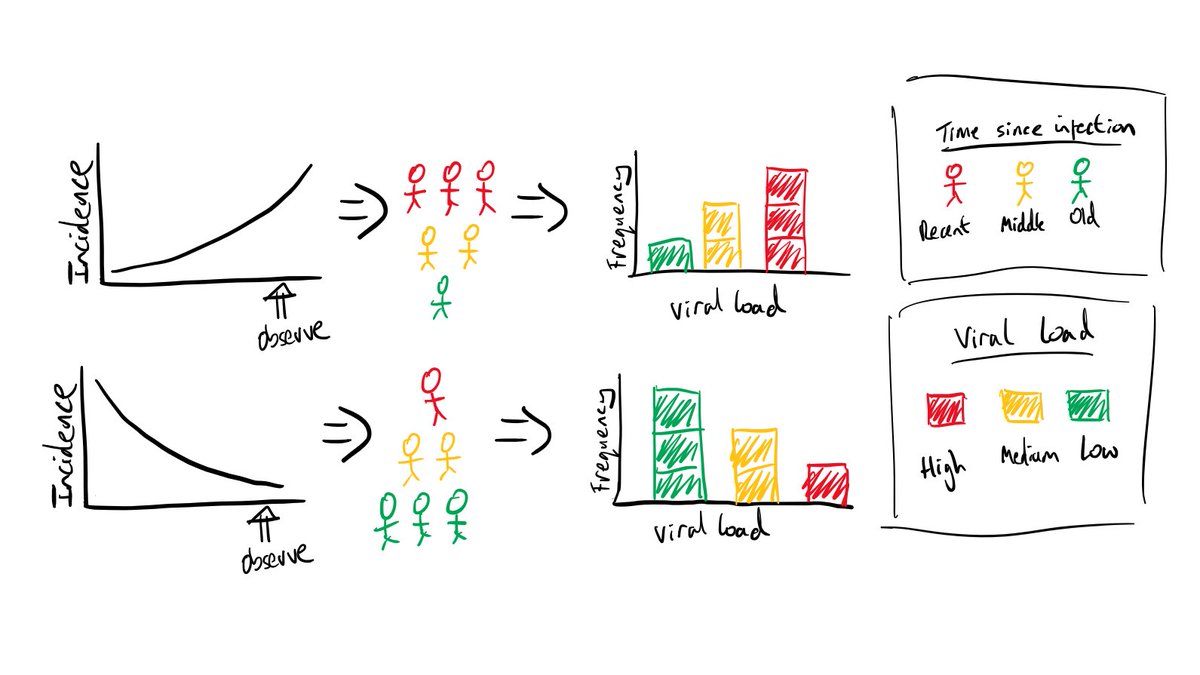
This is a simple cartoon, but it shows how epidemic dynamics -> time since infection distribution -> viral load distribution -> observed Ct values. How these steps link might change depending on eg. the instrument used to measure Ct values, but the general principle holds.
12/25
12/25
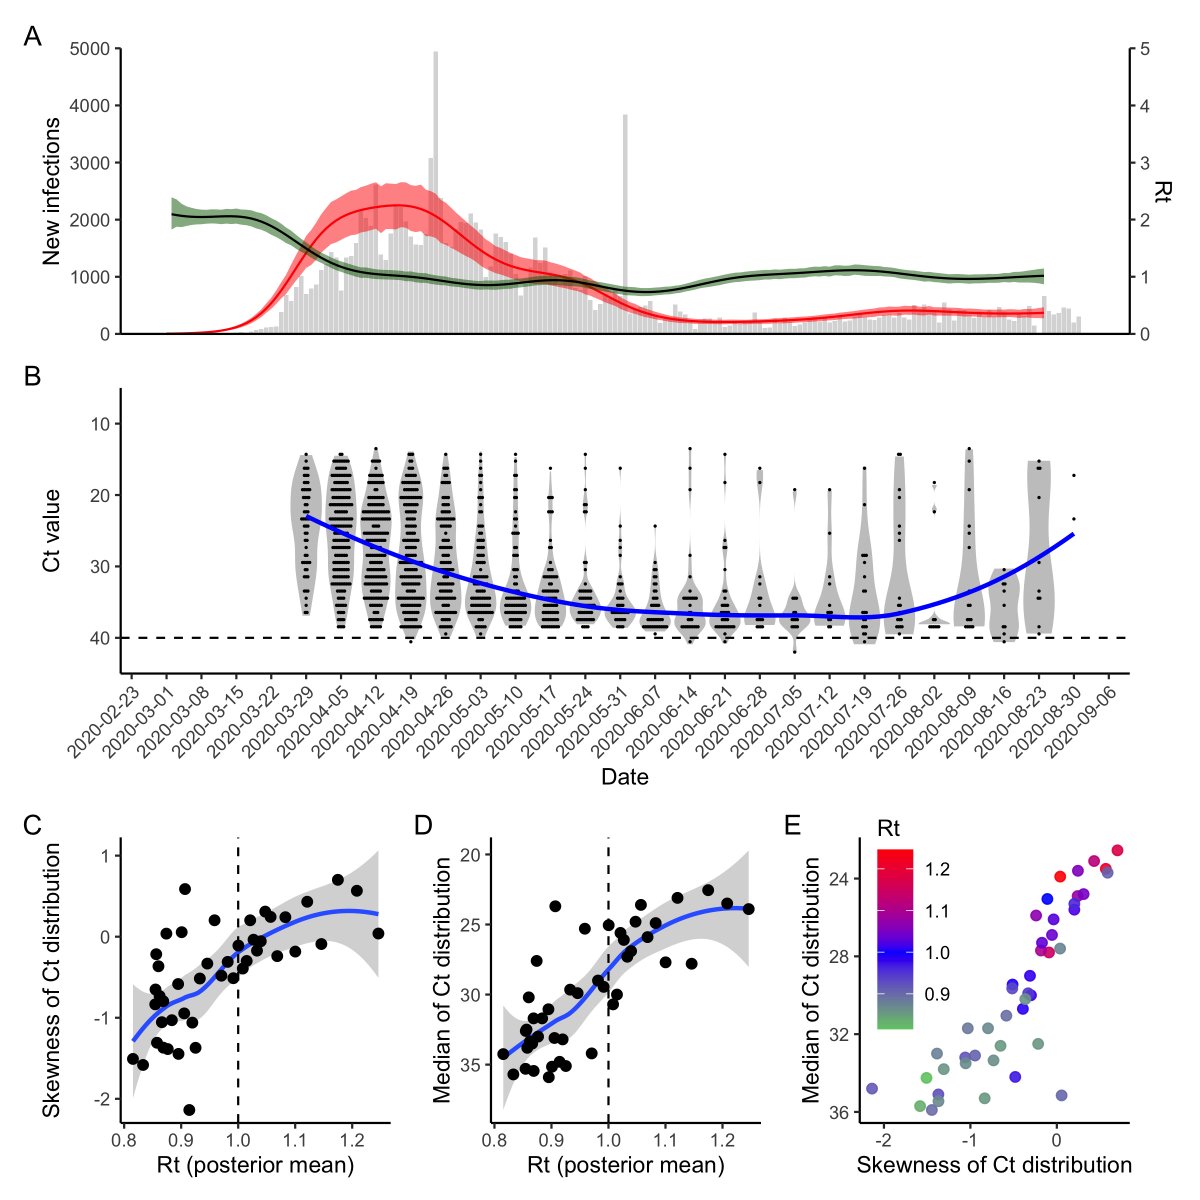
To demonstrate this, we simulated infections from an SEIR model. For each infected person, we simulated Ct values based on when in their infection course they were sampled. R(t) is clearly correlated with the median and skew of the detectable Ct distribution.
13/25
13/25

What about real data? We compared estimated R(t) (using EpiNow2) to the distribution of measured Ct values from Brigham & Women’s Hospital, MA since April. Despite a bit more noise, we saw the same relationship as in our theoretical predictions!
14/25
14/25
Finally, (and this is still WIP), we used this relationship to write down a model to infer the epidemic growth rate using the distribution of Ct values observed on a particular day.
15/25
15/25
The model has two parts: 1) a viral kinetics model describing the mean and variance of Ct values on each day post infection and 2) a model describing the relative probability of infection on each day prior to the observation day.
16/25
16/25
We found that with a single cross section of detectable Cts, we could correctly identify if the epidemic was growing or declining. They’re noisy estimates, but bear in mind this is showing longitudinal dynamics from a *single cross section* of data.
17/25
17/25

Also, to account for uncertainty in the viral kinetics trajectory, we used a Bayesian approach and placed informative priors on most of the model parameters rather than fixing them. If we knew these parameters with more certainty, these estimates would be more constrained.
18/25
18/25
We’ve shown how the distribution of Cts changes during an epidemic, which reflects the trajectory. We propose that incorporating Ct values epidemic dynamics inference can retain more information than simply assessing “how many new PCR positive tests did we report today?”
19/25
19/25
We can test whether the epidemic is growing or declining based on a single cross-section of viral load measurements. This could be a valuable tool to discern if rising case counts are due to true rises in incidence or just changing testing capacity, as some have suggested.
20/25
20/25
We hypothesize this method would be less susceptible to bias than R(t) estimation using case counts, which are hindered by reporting delays and testing capacity. The information here comes from the *distribution* of Cts rather than the (potentially biased) number of cases.
21/25
21/25
For anyone still skeptical, I refer to the large literature on using antibody titers to infer epidemic dynamics. Antibody titers -> time since infection -> incidence. This is exactly the same idea, just using viral loads.
journals.plos.org/ploscompbiol/a…
22/25
journals.plos.org/ploscompbiol/a…
22/25
There are some exciting extensions that we’re working on, so stay tuned for more data and some tighter posteriors! All code here: github.com/jameshay218/ct…
... though we're not able to share the raw BWH data at this time.
23/25
... though we're not able to share the raw BWH data at this time.
23/25
I foolishly put this at the end, but this is a joint endeavor with Lee Kennedy-Shaffer (not on twitter), led by @michaelmina_lab, with invaluable input from @SanjatKanjilal and @mlipsitch
24/25
24/25
… and I’ll stop there before someone has to start saying “THANK you, Mr. Vice President” over and over again until I shut up. (Topical reference, not suggesting that I’m important 🙃).
25/25
25/25
• • •
Missing some Tweet in this thread? You can try to
force a refresh


