
10/15 COVID-19 in Illinois thread begins here.
4,015 new cases, 67,086 tests run.
5.98% positivity rate for this batch. (was 5.43% yesterday)
State's 7-day rolling avg. positivity rate increases again to: 4.9%
4,015 new cases, 67,086 tests run.
5.98% positivity rate for this batch. (was 5.43% yesterday)
State's 7-day rolling avg. positivity rate increases again to: 4.9%
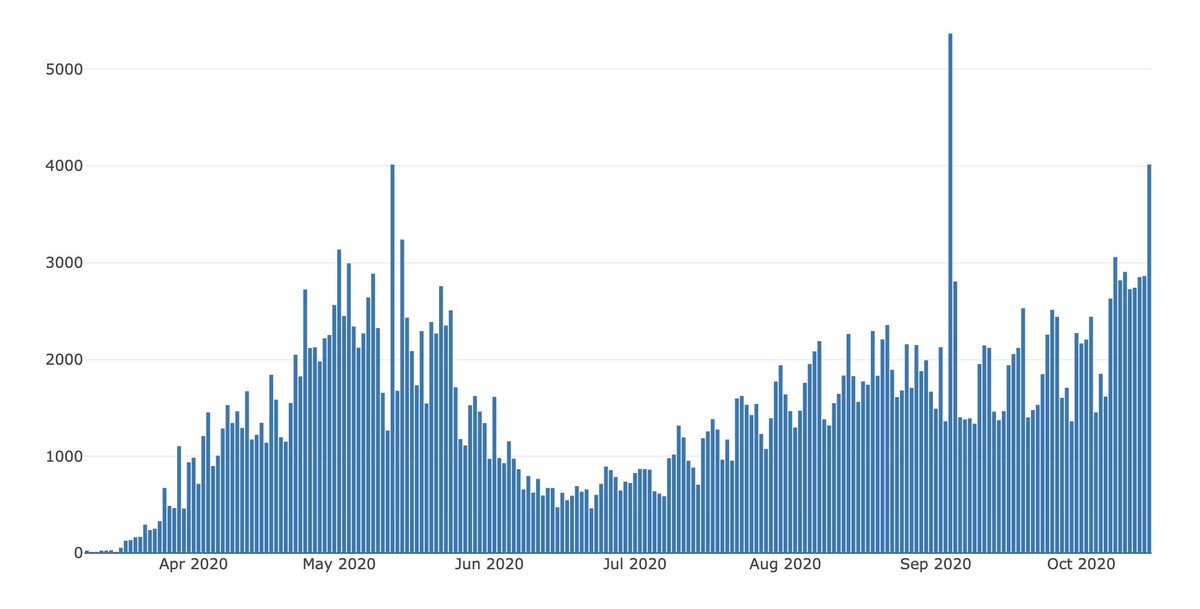
4,015 new cases is a single-day record, breaking the old record of 4,014, which was set on May 12.
The pandemic in Illinois in full, this is cases.
(Yes there is a 5,368 day in there from September, that was a backlog being filled, 3 days of data there).
The pandemic in Illinois in full, this is cases.
(Yes there is a 5,368 day in there from September, that was a backlog being filled, 3 days of data there).
Illinois is not the only state setting records, or adding in Antigen test data.
Minnesota just set a new single-day one for deaths. startribune.com/minn-reports-h…
Minnesota just set a new single-day one for deaths. startribune.com/minn-reports-h…
North Carolina, new record for cases: wral.com/nc-marks-new-r…
Ohio, new record for cases. dispatch.com/story/news/202…
Wisconsin, new record for hospitalizations wbay.com/2020/10/14/cor…
53 new deaths announced. Highest number of deaths in one day since June 24.
⬇️ 1,932 COVID patients in the hospital.
⬇️ 388 patients in the ICU.
⬇️ 147 patients on ventilators.
⬇️ 1,932 COVID patients in the hospital.
⬇️ 388 patients in the ICU.
⬇️ 147 patients on ventilators.
🛑 Region 1 (DeKalb and west to Whiteside):
🚨 7/10 days of positivity increases. (+1)
🚨 10.3% positivity rate for the last day entered. (+0.2)
3/10 days of hospital increases. (+1)
34% of hospital beds available.
40% of ICU beds available.
🚨 7/10 days of positivity increases. (+1)
🚨 10.3% positivity rate for the last day entered. (+0.2)
3/10 days of hospital increases. (+1)
34% of hospital beds available.
40% of ICU beds available.
***Regional data always 3 days behind***
Region 1 turned in a 10.9% day for Oct. 12, and will lose a 12.0% day off its 7-day average tomorrow.
Region 1 turned in a 10.9% day for Oct. 12, and will lose a 12.0% day off its 7-day average tomorrow.
Winnebago County did 52.2% of the region's testing on Oct. 12, and turned in an 12.8% positive day.
DeKalb County: 12.3% of the region's tests, 8.3% positive. 7-day avg. down to 8.5%.
Whiteside: Only 3% of the tests, and 5.3% positive. 7-day avg. down to 9.6%.
DeKalb County: 12.3% of the region's tests, 8.3% positive. 7-day avg. down to 8.5%.
Whiteside: Only 3% of the tests, and 5.3% positive. 7-day avg. down to 9.6%.
Region 2 (Kendall, La Salle, all the way to Henderson)
4/10 days of positivity increases.
5.6% positivity rate for the last day entered.
2/10 days of hospital increases.
36% of hospital beds available.
41% of ICU beds available.
4/10 days of positivity increases.
5.6% positivity rate for the last day entered.
2/10 days of hospital increases.
36% of hospital beds available.
41% of ICU beds available.
Region 3 (Springfield area)
6/10 days of positivity increases. (+1)
6.4% positivity rate for the last day entered. (+0.3), fifth straight day w/an increase
3/10 days of hospital increases.
36% of hospital beds available.
36% of ICU beds available.
6/10 days of positivity increases. (+1)
6.4% positivity rate for the last day entered. (+0.3), fifth straight day w/an increase
3/10 days of hospital increases.
36% of hospital beds available.
36% of ICU beds available.
Region 4 (St. Louis area)
6/10 days of positivity increases. (+1)
6.9% positivity rate for the last day entered. (+0.1), sixth straight day w/an increase
3/10 days of hospital increases.
29% of hospital beds available
48% of ICU beds available
6/10 days of positivity increases. (+1)
6.9% positivity rate for the last day entered. (+0.1), sixth straight day w/an increase
3/10 days of hospital increases.
29% of hospital beds available
48% of ICU beds available
Region 5 (southern)
🚨 8/10 days of positivity increases. (-1)
7.5% positivity rate for the last day entered. (-0.2), second straight day w/a decrease
5/10 days of hospital increases.
45% of hospital beds available.
53% of ICU beds available
🚨 8/10 days of positivity increases. (-1)
7.5% positivity rate for the last day entered. (-0.2), second straight day w/a decrease
5/10 days of hospital increases.
45% of hospital beds available.
53% of ICU beds available
Region 6 (Iroquois to Champaign to Clay counties)
3/10 days of positivity increases.
2.2% positivity rate for the last day entered.
6/10 days of hospital increases. (+1)
34% of hospital beds available.
46% of ICU beds available.
3/10 days of positivity increases.
2.2% positivity rate for the last day entered.
6/10 days of hospital increases. (+1)
34% of hospital beds available.
46% of ICU beds available.
Region 6 (Iroquois to Champaign to Clay counties)
***w/out Champaign County
5/10 days of positivity increases.
6.6% positivity rate for the last day entered.
***w/out Champaign County
5/10 days of positivity increases.
6.6% positivity rate for the last day entered.
Region 7 (Will/Kankakee)
🚨 7/10 days of positivity increases.
6.6% positivity rate for the last day entered. (+0.3), fifth straight day w/an increase.
6/10 days of hospital increases. (+1)
29% of hospital beds available.
29% of ICU beds available.
🚨 7/10 days of positivity increases.
6.6% positivity rate for the last day entered. (+0.3), fifth straight day w/an increase.
6/10 days of hospital increases. (+1)
29% of hospital beds available.
29% of ICU beds available.
^^^ For Region 7, a reminder that positivity rate is NOT the only metric the state uses to put mitigations on a region.
7/10 days of rising positivity and 7/10 days of rising hospitalizations can do it too. @JoeHosey and @Joliet_HN will have you covered if it happens.
7/10 days of rising positivity and 7/10 days of rising hospitalizations can do it too. @JoeHosey and @Joliet_HN will have you covered if it happens.
Source material for the above tweet: coronavirus.illinois.gov/s/restore-illi…
Region 8 (Kane/DuPage)
🚨 8/10 days of positivity increases. (+1)
7.0% positivity rate for the last day entered. (+0.3), eighth straight day w/an increase
4/10 days of hospital increases.
31% of hospital beds available.
46% of ICU beds available.
🚨 8/10 days of positivity increases. (+1)
7.0% positivity rate for the last day entered. (+0.3), eighth straight day w/an increase
4/10 days of hospital increases.
31% of hospital beds available.
46% of ICU beds available.
📈Kane County's seven-day rolling avg. is now 8.1%. It turned in a 10.6% positive day on Oct. 12.
📈 DuPage County was 4.5% 10 days ago. It is now 6.4%.
📈 DuPage County was 4.5% 10 days ago. It is now 6.4%.
Region 9 (McHenry/Lake)
6/10 days of positivity increases. (+1)
6.3% positivity rate for the last day entered. (+0.1)
6/10 days of hospital increases.
36% of hospital beds available.
51% of ICU beds available
6/10 days of positivity increases. (+1)
6.3% positivity rate for the last day entered. (+0.1)
6/10 days of hospital increases.
36% of hospital beds available.
51% of ICU beds available
Same heads up for Region 9 as Region 7.
7 days of increases in positivity AND 7 days of increases in hospitalizations can get your region more mitigations. @MEKColeman and @nwherald will have you covered if that happens. coronavirus.illinois.gov/s/restore-illi…
7 days of increases in positivity AND 7 days of increases in hospitalizations can get your region more mitigations. @MEKColeman and @nwherald will have you covered if that happens. coronavirus.illinois.gov/s/restore-illi…
McHenry County's rolling positivity rate has been bouncing around the 8s for most of the week.

Region 10 (Suburban Cook)
🚨 7/10 days of positivity increases. (+1)
6.2% positivity rate for the last day entered. (+0.3), fourth straight day w/an increase
6/10 days of hospital increases.
24% of hospital beds available.
31% of ICU beds available.
🚨 7/10 days of positivity increases. (+1)
6.2% positivity rate for the last day entered. (+0.3), fourth straight day w/an increase
6/10 days of hospital increases.
24% of hospital beds available.
31% of ICU beds available.
Region 11 (Chicago)
5/10 days of positivity increases. (+1)
5.2% positivity rate for the last day entered. (+0.3), fourth straight day w/an increase
6/10 days of hospital increases.
25% of hospital beds available.
32% of ICU beds available.
5/10 days of positivity increases. (+1)
5.2% positivity rate for the last day entered. (+0.3), fourth straight day w/an increase
6/10 days of hospital increases.
25% of hospital beds available.
32% of ICU beds available.
10/15 summary:
We've got a few more regions at risk for more mitigations, and when you remember that regional data is three days behind, they might already be at the necessary numbers to get there.
We've got a few more regions at risk for more mitigations, and when you remember that regional data is three days behind, they might already be at the necessary numbers to get there.
• • •
Missing some Tweet in this thread? You can try to
force a refresh


