10/16 COVID-19 in Illinois thread begins here.
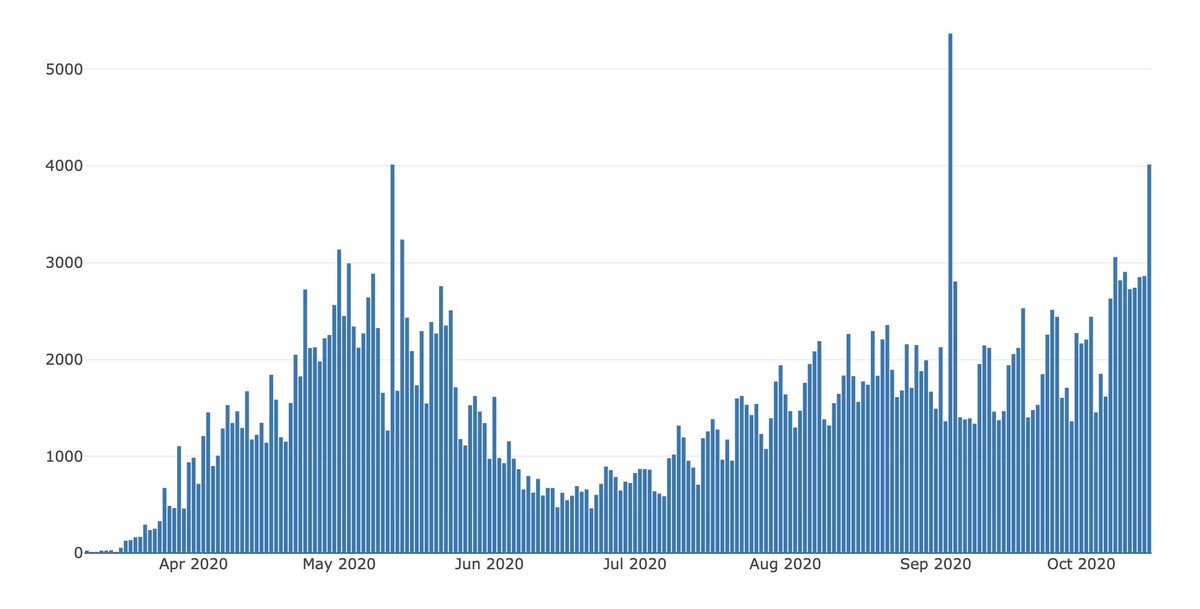
4,554 new cases, 87,759 tests run.
5.18% positivity rate for this batch. (was 5.98% yesterday)
State's 7-day rolling avg. positivity rate increases again to: 5.1%
4,554 new cases, 87,759 tests run.
5.18% positivity rate for this batch. (was 5.98% yesterday)
State's 7-day rolling avg. positivity rate increases again to: 5.1%
New single-day state records today:
4,554 new cases is a single-day record, breaking the old record of 4,015, which was set yesterday.
87,759 tests run in a single day. Smashes the single-day record by about 15,000, as @IDPH now adds in Antigen testing.
4,554 new cases is a single-day record, breaking the old record of 4,015, which was set yesterday.
87,759 tests run in a single day. Smashes the single-day record by about 15,000, as @IDPH now adds in Antigen testing.
38 new deaths announced.
⬆️ 2,016 COVID patients in the hospital. Most since June 12.
⬆️ 410 patients in the ICU. Most since June 22.
⬆️ 151 patients on ventilators.
⬆️ 2,016 COVID patients in the hospital. Most since June 12.
⬆️ 410 patients in the ICU. Most since June 22.
⬆️ 151 patients on ventilators.
🛑 Region 1 (DeKalb and west to Whiteside):
🚨 8/10 days of positivity increases. (+1)
🚨 10.6% positivity rate for the last day entered. (+0.3)
3/10 days of hospital increases.
31% of hospital beds available.
39% of ICU beds available.
🚨 8/10 days of positivity increases. (+1)
🚨 10.6% positivity rate for the last day entered. (+0.3)
3/10 days of hospital increases.
31% of hospital beds available.
39% of ICU beds available.
***Regional data always 3 days behind***
Region 1 turned in a 13.9% day for Oct. 13, and will lose a 9.5% day off its 7-day average tomorrow.
Region 1 turned in a 13.9% day for Oct. 13, and will lose a 9.5% day off its 7-day average tomorrow.
Winnebago County did 57.7% of the region's testing on Oct. 13, and turned in an 14.7% positive day.
DeKalb County: 15.4% of the region's tests, 7.8% positive. 7-day avg. down to 8.1%.
Whiteside: Only 3.8% of the tests, and 18.3% positive. 7-day avg. down to 9.5%.
DeKalb County: 15.4% of the region's tests, 7.8% positive. 7-day avg. down to 8.1%.
Whiteside: Only 3.8% of the tests, and 18.3% positive. 7-day avg. down to 9.5%.
Region 2 (Kendall, La Salle, all the way to Henderson)
5/10 days of positivity increases. (+1)
6.0% positivity rate for the last day entered. (+0.4)
2/10 days of hospital increases.
34% of hospital beds available.
39% of ICU beds available.
5/10 days of positivity increases. (+1)
6.0% positivity rate for the last day entered. (+0.4)
2/10 days of hospital increases.
34% of hospital beds available.
39% of ICU beds available.
Region 3 (Springfield area)
🚨 7/10 days of positivity increases. (+1)
6.7% positivity rate for the last day entered. (+0.3), sixth straight day w/an increase
3/10 days of hospital increases.
34% of hospital beds available.
35% of ICU beds available.
🚨 7/10 days of positivity increases. (+1)
6.7% positivity rate for the last day entered. (+0.3), sixth straight day w/an increase
3/10 days of hospital increases.
34% of hospital beds available.
35% of ICU beds available.
Region 4 (St. Louis area)
🚨 7/10 days of positivity increases. (+1)
7.0% positivity rate for the last day entered. (+0.1), seventh straight day w/an increase
3/10 days of hospital increases.
27% of hospital beds available
44% of ICU beds available
🚨 7/10 days of positivity increases. (+1)
7.0% positivity rate for the last day entered. (+0.1), seventh straight day w/an increase
3/10 days of hospital increases.
27% of hospital beds available
44% of ICU beds available
Region 5 (southern)
🚨 8/10 days of positivity increases.
7.8% positivity rate for the last day entered. (+0.3)
5/10 days of hospital increases.
44% of hospital beds available.
54% of ICU beds available
🚨 8/10 days of positivity increases.
7.8% positivity rate for the last day entered. (+0.3)
5/10 days of hospital increases.
44% of hospital beds available.
54% of ICU beds available
Region 6 (Iroquois to Champaign to Clay counties)
4/10 days of positivity increases. (+1)
2.4% positivity rate for the last day entered. (+0.2)
5/10 days of hospital increases. (-1)
31% of hospital beds available.
45% of ICU beds available.
4/10 days of positivity increases. (+1)
2.4% positivity rate for the last day entered. (+0.2)
5/10 days of hospital increases. (-1)
31% of hospital beds available.
45% of ICU beds available.
Region 6 (Iroquois to Champaign to Clay counties)
***w/out Champaign County
6/10 days of positivity increases. (+1)
7.4% positivity rate for the last day entered. (+0.8)
***w/out Champaign County
6/10 days of positivity increases. (+1)
7.4% positivity rate for the last day entered. (+0.8)
Region 7 (Will/Kankakee)
🚨 7/10 days of positivity increases.
6.8% positivity rate for the last day entered. (+0.2), sixth straight day w/an increase.
🚨 7/10 days of hospital increases. (+1)
27% of hospital beds available.
27% of ICU beds available.
🚨 7/10 days of positivity increases.
6.8% positivity rate for the last day entered. (+0.2), sixth straight day w/an increase.
🚨 7/10 days of hospital increases. (+1)
27% of hospital beds available.
27% of ICU beds available.
^^^ For Region 7, a reminder that positivity rate is NOT the only metric the state uses to put mitigations on a region.
7/10 days of rising positivity and 7/10 days of rising hospitalizations can do it too. @JoeHosey
and @Joliet_HN have you covered if mitigations are announced.
7/10 days of rising positivity and 7/10 days of rising hospitalizations can do it too. @JoeHosey
and @Joliet_HN have you covered if mitigations are announced.
Region 8 (Kane/DuPage)
🚨 9/10 days of positivity increases. (+1)
7.4% positivity rate for the last day entered. (+0.4), ninth straight day w/an increase
5/10 days of hospital increases. (+1)
30% of hospital beds available.
43% of ICU beds available.
🚨 9/10 days of positivity increases. (+1)
7.4% positivity rate for the last day entered. (+0.4), ninth straight day w/an increase
5/10 days of hospital increases. (+1)
30% of hospital beds available.
43% of ICU beds available.
📈 Kane County's seven-day rolling avg. is now 9.1%. It turned in a 15.5% positive day on Oct. 13.
📈 DuPage County was 4.5% 11 days ago. It is now 6.6%.
📈 DuPage County was 4.5% 11 days ago. It is now 6.6%.
Region 9 (McHenry/Lake)
6/10 days of positivity increases.
6.6% positivity rate for the last day entered. (+0.3)
5/10 days of hospital increases. (-1)
34% of hospital beds available.
50% of ICU beds available
6/10 days of positivity increases.
6.6% positivity rate for the last day entered. (+0.3)
5/10 days of hospital increases. (-1)
34% of hospital beds available.
50% of ICU beds available
McHenry County getting back up into the high 8s for its rolling positivity rate, per IDPH. 

That said, @KelliannDuncan and @cjbuchman reported the differences between how IDPH and how McHenry County count positivity rate nwherald.com/2020/10/13/mch…
Region 10 (Suburban Cook)
🚨 7/10 days of positivity increases. (+1)
6.3% positivity rate for the last day entered. (+0.1), fifth straight day w/an increase
5/10 days of hospital increases. (-1)
😬 22% of hospital beds available.
29% of ICU beds available.
🚨 7/10 days of positivity increases. (+1)
6.3% positivity rate for the last day entered. (+0.1), fifth straight day w/an increase
5/10 days of hospital increases. (-1)
😬 22% of hospital beds available.
29% of ICU beds available.
Region 11 (Chicago)
5/10 days of positivity increases.
5.4% positivity rate for the last day entered. (+0.2), fifth straight day w/an increase
6/10 days of hospital increases.
😬 22% of hospital beds available.
30% of ICU beds available.
5/10 days of positivity increases.
5.4% positivity rate for the last day entered. (+0.2), fifth straight day w/an increase
6/10 days of hospital increases.
😬 22% of hospital beds available.
30% of ICU beds available.
10/16 summary:
Again, this is going to get worse before it gets better.
Hospitalizations are on the rise to early June levels. Region 1 looks like a mess and is on its way to extra mitigations.
Again, this is going to get worse before it gets better.
Hospitalizations are on the rise to early June levels. Region 1 looks like a mess and is on its way to extra mitigations.
• • •
Missing some Tweet in this thread? You can try to
force a refresh