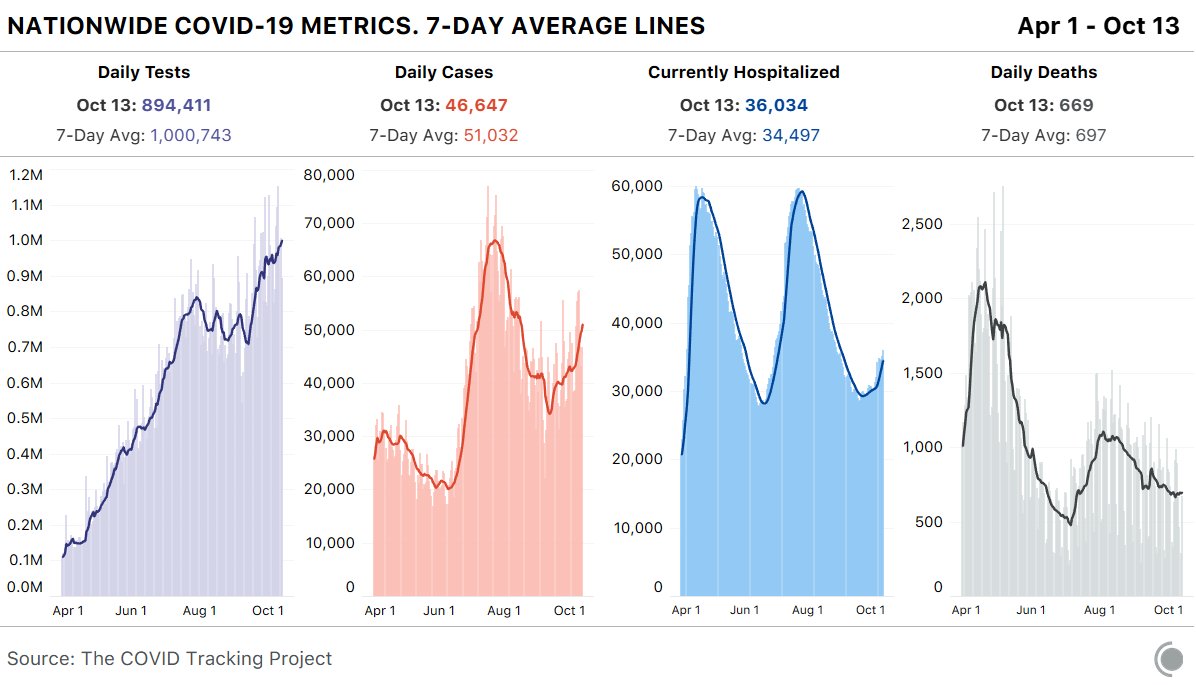
Our daily update is published. States reported 1 million tests, 63k cases, and 951 deaths. 37k people are currently hospitalized with COVID-19.
Today’s national case count was the highest since late-July. Several states reported their highest-ever case totals, some of which also broke their hospitalization records.
After a month of warning signs, this week’s alarming numbers make it clear that the third surge of COVID-19 in the US has arrived. Sadly, we're not only seeing an increase in cases and hosp., but deaths are also starting to rise, after a 3-week downtrend.
Hospitalizations declined to just below 30k nationwide on both June and Sep 20, turning upwards again in the following weeks. But the surge we’re seeing now looks a little different: It’s less abrupt, and much more geographically widespread.
Our daily update is published. States reported 1.17 million tests, 60k cases, and 797 deaths. 37k people are currently hospitalized with COVID-19.
Wisconsin and four other states—Connecticut, Louisiana, Kansas, Rhode Island—did not update their case numbers today.
Today's case count was high, despite the absence of these states.
Last night, we switched our TotalTestResults data field to a better time series that's now publicly provided by the state of Indiana. This resulted in a 918k cumulative increase in tests completed. We also added the state's positive PCR test results data. covidtracking.com/data/state/ind…
The COVID Racial Data Tracker has launched shareable charts of per capita cases and deaths, broken out by the race and ethnicity categories reported. Sharing a few examples in this thread. covidtracking.com/race/infection…
The New Mexico chart shows how much more likely ‘American Indian or Alaska Native’ people have been to test positive or die from COVID-19 since the pandemic began, compared to other people in the state. covidtracking.com/race/infection…
We are able to see the disparate impact of COVID-19 for each state and territory with these cards.
In Tennessee, the ‘Hispanic or Latino’ population is much more likely to have tested positive for COVID-19. covidtracking.com/race/infection…
Our daily update is published. States reported 894k tests, 47k cases, and 669 deaths. 36k people are currently hospitalized with COVID-19, the highest count since late-August.
Case counts are increasing in 36 states. Wisconsin, one of the worst hotspots in the country this week, reported 3.4k cases today, 65% more than a week ago.
Hospitalization numbers are also growing in all but seven states, following the upward trend in case counts.
Our daily update is published. States reported 1.1 million tests, 58k cases, 35k currently hospitalized, and 904 COVID-19 deaths. Today's case count is the highest since August 7.
We continue our rolling updates to the metrics tracked in our original totalTestResults API field. We updated test metrics for Hawaii today, resulting in a ~3.4k increase in daily new tests and a ~131k cumulative increase. Follow our progress here: covidtracking.com/about-data/tot…
The rise today is due to switching Hawaii’s test units in totalTestResults from positive + negative unique people tested to directly reported test encounters, in accordance with our policy explained in detail here covidtracking.com/blog/counting-…
Our daily update is published. States reported 1 million tests, 55k cases, and 975 deaths. 34k people are currently hospitalized with COVID-19. WI, ND, UT and WY reported record high case counts today.
Missouri added current hospitalizations back to their dashboard, so we updated this metric in our data. Today’s hospitalization count—1,344—was MO’s highest ever.
Starting today, we are displaying a breakdown of confirmed and probable cases on our site for any state where the data is available. We are also releasing a new field, probableCases, in our API. In most states, this data goes back to April 29.
You’ve probably heard about test positivity—a powerful metric that can reveal the percentage of COVID-19 tests coming back positive. This metric comes with some pretty big caveats. Let’s break them down: covidtracking.com/blog/test-posi…
The first disclaimer is that test positivity reflects the % of people tested who have the virus, but not necessarily the % of people in the entire population who have the virus. So this metric only shows a portion of reality. covidtracking.com/blog/test-posi…
This makes it very tricky to make good assumptions based on test positivity, as it changes depending on who gets tested. Here, if different groups of people were tested, our numbers would vary anywhere from 1 to 16%, even though the total number of infections is the same.