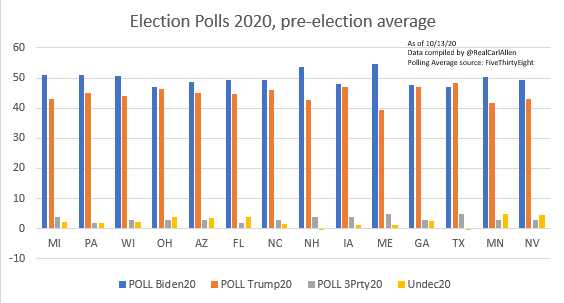
Here's my Election Forecast and accompanying map.
I think IA (lean D) GA (lean D) along with TX (lean R) and OH (lean R) will be the closest states. Maybe too close to call on election night
But Biden wins FL, PA, MI and WI by comfortable enough margins that election is called.
I think IA (lean D) GA (lean D) along with TX (lean R) and OH (lean R) will be the closest states. Maybe too close to call on election night
But Biden wins FL, PA, MI and WI by comfortable enough margins that election is called.

So some of you know but for those who don't, my background is in sports data.
When it comes to sports betting, it's not good enough to pick the winner, you need to be able to predict the spread too. So let's compare my final vote predictions to those of the top forecasters.
When it comes to sports betting, it's not good enough to pick the winner, you need to be able to predict the spread too. So let's compare my final vote predictions to those of the top forecasters.
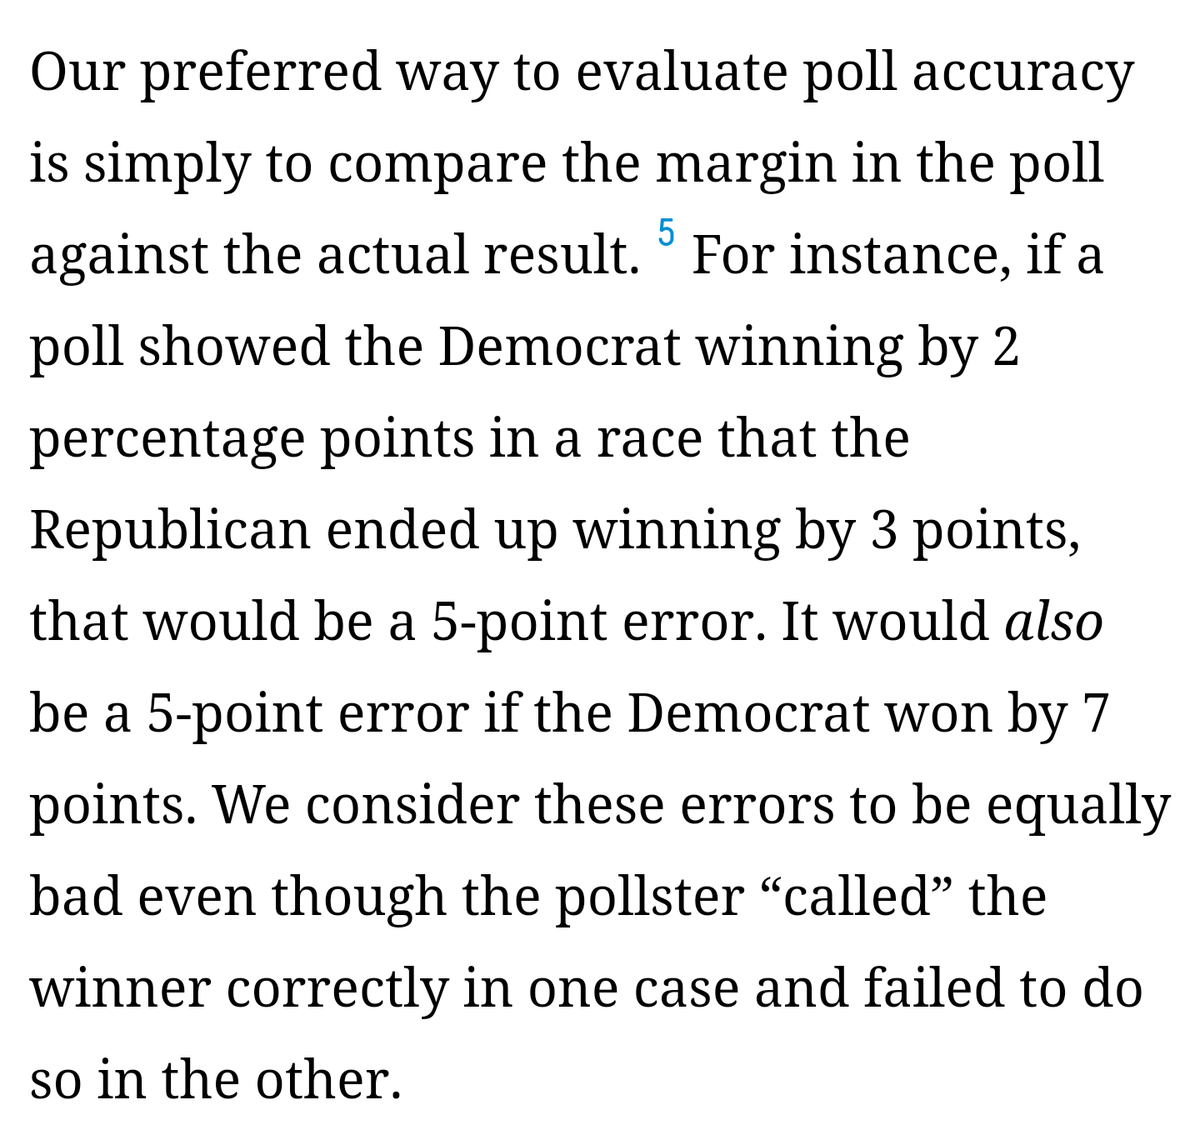
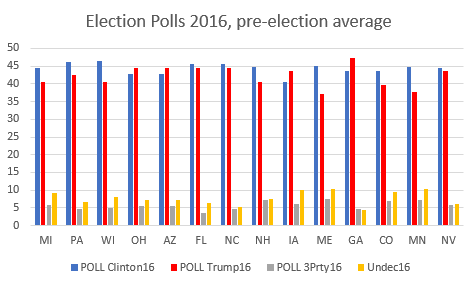
And to clarify:
Election margin - the thing everyone tries to predict - is a function of FORECASTING.
The poll margin - the thing I'm trying to educate people about what it actually means - is not about a forecast. It's about understanding data.
So with that, some charts...
Election margin - the thing everyone tries to predict - is a function of FORECASTING.
The poll margin - the thing I'm trying to educate people about what it actually means - is not about a forecast. It's about understanding data.
So with that, some charts...
As promised, here's my swing state forecast based on Election margin, compared to @FiveThirtyEight and @TheEconomist.
538 and The Economist are within 2% on all their state forecasts. I have 5 states greater 2% different from theirs:
NV +13.1%
ME +17%
AZ +6.2%
NH +3.4%
GA +2.8%
538 and The Economist are within 2% on all their state forecasts. I have 5 states greater 2% different from theirs:
NV +13.1%
ME +17%
AZ +6.2%
NH +3.4%
GA +2.8%

So now for the fun part. *Why* these discrepancies?
I found it almost immediately.
538 forecasts undecideds will go to Biden in the following proportions:
NV: 63.8%
ME: 27.1%
AZ: 45.2%
NH: 34.4%
GA: 39.5%
I think:
NV: 70% + 1% higher poll avg
ME: 50%
AZ: 65%
NH: 40%
GA: 65%
I found it almost immediately.
538 forecasts undecideds will go to Biden in the following proportions:
NV: 63.8%
ME: 27.1%
AZ: 45.2%
NH: 34.4%
GA: 39.5%
I think:
NV: 70% + 1% higher poll avg
ME: 50%
AZ: 65%
NH: 40%
GA: 65%
(I found this by taking their polling average minus projected vote share, divided by total undecideds)
Their "demographics-based" adjustment ranges from 11% to 23% in swing states. Meaning it's not *only* undecideds that influence their final numbers, but largely so.
Their "demographics-based" adjustment ranges from 11% to 23% in swing states. Meaning it's not *only* undecideds that influence their final numbers, but largely so.
And here's my Senate Forecast! Last week's numbers but not a lot has changed.
Dems are strong favorites - but not locks - to retake the Senate.
Dems are strong favorites - but not locks - to retake the Senate.

If you're looking for a big picture Senate Forecast here's what I have.
51 and 52 seats being the most likely outcome (about 20% each) with 53 and 50 making up an additional 33%.
51 and 52 seats being the most likely outcome (about 20% each) with 53 and 50 making up an additional 33%.

• • •
Missing some Tweet in this thread? You can try to
force a refresh