
Tweetorial on going from regression to estimating causal effects with machine learning.
I get a lot of questions from students regarding how to think about this *conceptually*, so this is a beginner-friendly #causaltwitter high-level overview with additional references.
I get a lot of questions from students regarding how to think about this *conceptually*, so this is a beginner-friendly #causaltwitter high-level overview with additional references.

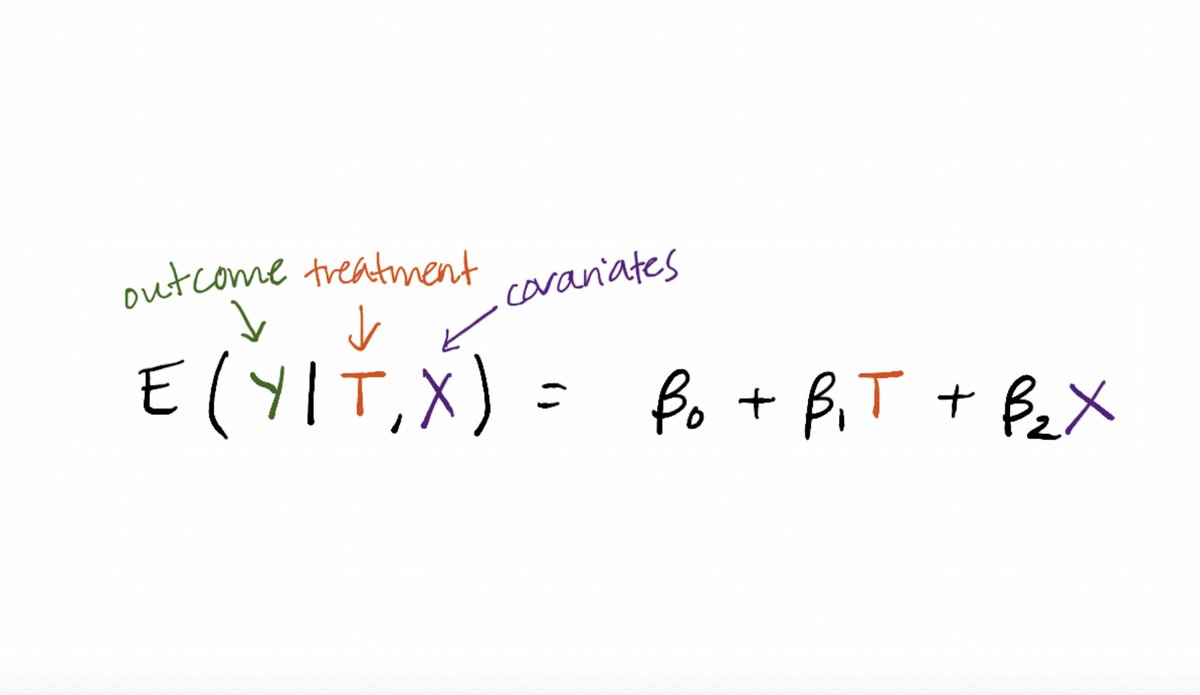
One thing to keep in mind is that a traditional parametric regression is estimating a conditional mean E(Y|T,X).
The bias—variance tradeoff is for that conditional mean, not the coefficients in front of T and X.
The bias—variance tradeoff is for that conditional mean, not the coefficients in front of T and X.
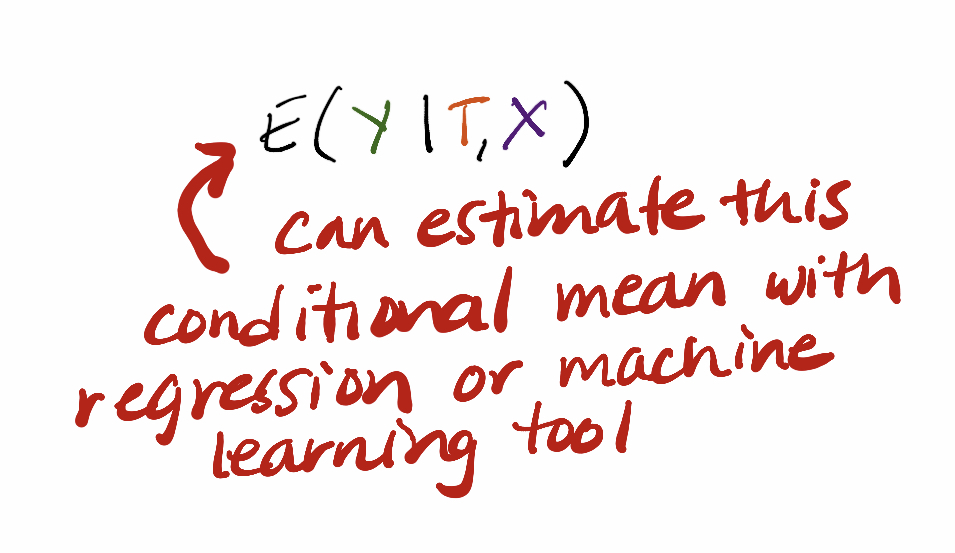
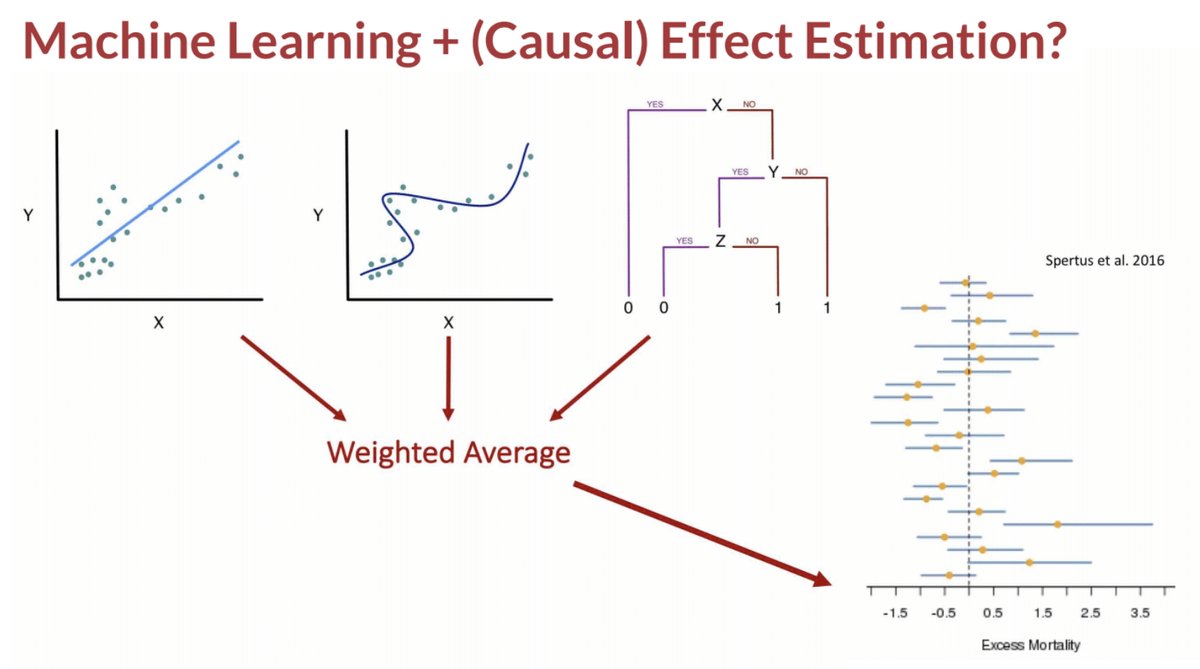
The next step to think about conceptually is that this conditional mean E(Y|T,X) can be estimated with other tools. Yes, standard parametric regression, but also machine learning tools like random forests.
It’s OK if this is big conceptual leap for you! It is for many people!
It’s OK if this is big conceptual leap for you! It is for many people!
But now you’re also worried. Where did the coefficients go?
I care about a treatment effect and if I estimate E(Y|T,X) with some machine learning tools, the coefficients aren’t there.
I care about a treatment effect and if I estimate E(Y|T,X) with some machine learning tools, the coefficients aren’t there.
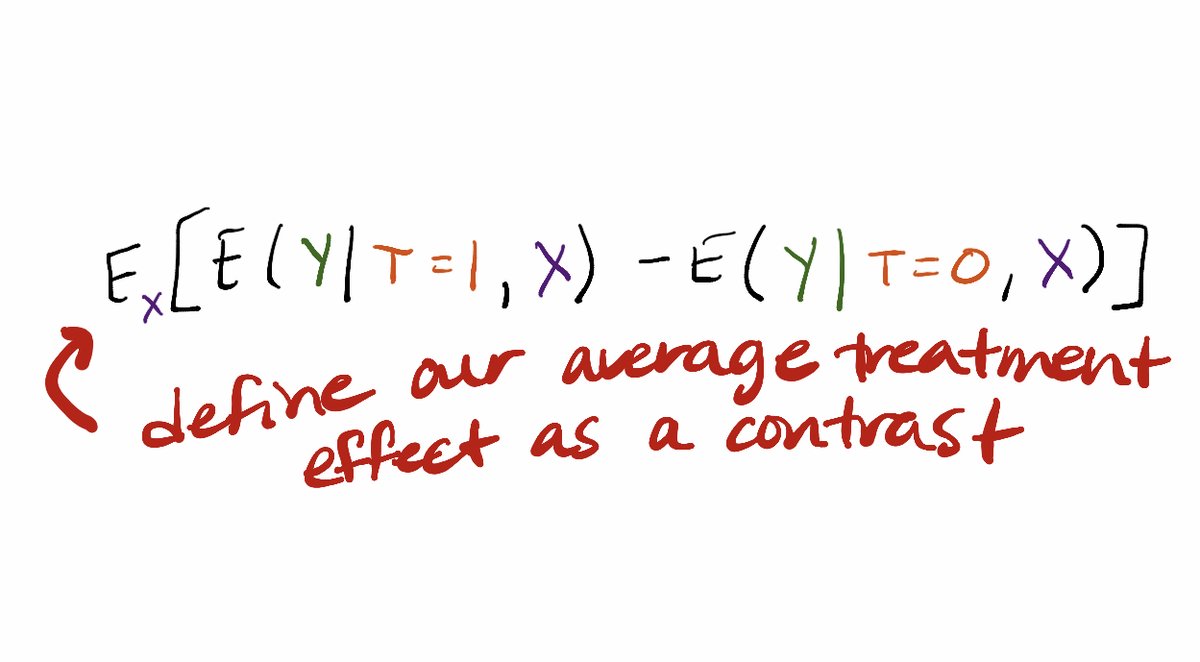
We can think about defining our parameters more flexibly outside the context of a parametric model!
Can write the average treatment effect as the contrast: E_X[E(Y|T=1,X)-E(Y|T=0,X)].
Can write the average treatment effect as the contrast: E_X[E(Y|T=1,X)-E(Y|T=0,X)].
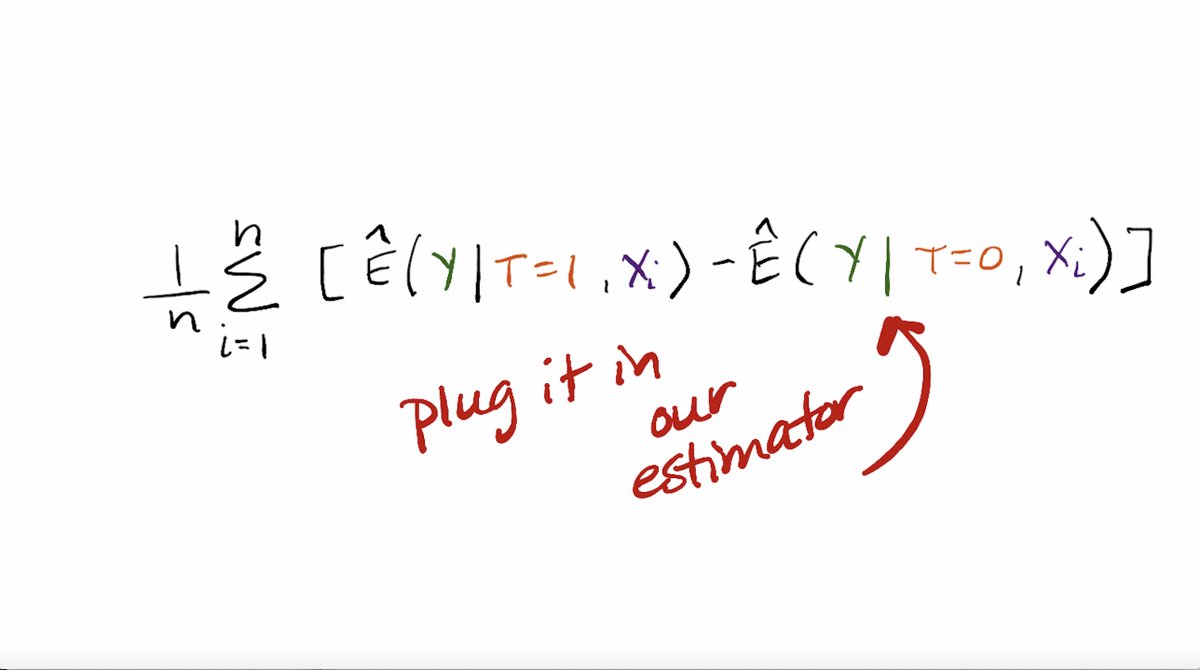
Now we can move to thinking about how to operationalize estimating that treatment effect with machine learning. Here is how we write down our estimator.
You can see the conditional means, except we need to have estimates under the setting that treatment is equal to 1 and 0.
You can see the conditional means, except we need to have estimates under the setting that treatment is equal to 1 and 0.

This involves:
(1) estimating E(Y|T,X) with our machine learning tool.
(2) Setting all observations to T=1 and using our fixed algorithm to obtain predicted values for each observation.
(3) Repeating (2) for T=0.
Now we can plug these values into the estimator!
(1) estimating E(Y|T,X) with our machine learning tool.
(2) Setting all observations to T=1 and using our fixed algorithm to obtain predicted values for each observation.
(3) Repeating (2) for T=0.
Now we can plug these values into the estimator!
What I described is a machine learning-based substitution estimator of the g-formula.
There are other ML-based estimators for effects, including methods that use the propensity score or both the outcome regression and propensity score.
Read more: academic.oup.com/ije/advance-ar…
There are other ML-based estimators for effects, including methods that use the propensity score or both the outcome regression and propensity score.
Read more: academic.oup.com/ije/advance-ar…
Now interpreting any of these effects as ***causal*** requires an additional set of assumptions.
The statistical model can be augmented with causal assumptions that allow an enriched interpretation of the treatment effect parameter.
Read more: journals.lww.com/epidem/Fulltex…
The statistical model can be augmented with causal assumptions that allow an enriched interpretation of the treatment effect parameter.
Read more: journals.lww.com/epidem/Fulltex…
![Hand-drawn graphic of the formula E_X[E(Y|T=1,X)-E(Y|T=0,X)]](https://pbs.twimg.com/media/EldGhTlU8AA0vT1.jpg)
I describe these steps from regression to machine learning for causal inference in more detail in my short courses (drsherrirose.org/short-courses), for example this workshop at UCSF: dropbox.com/s/wmgv51j21t3n… (starting slide 147).
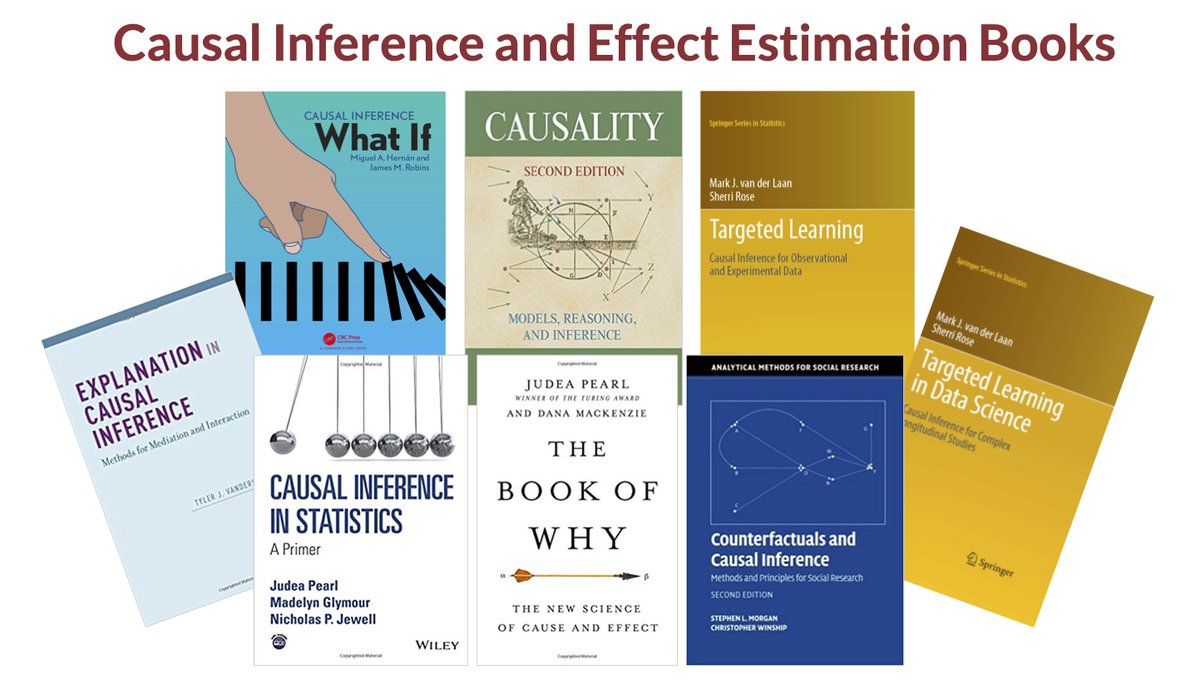
There are many books on causal inference (I have co-authored two). Our targeted learning books on machine learning for causal inference can be downloaded free if you have institutional access, and two of the introductory chapters are free on my website: drsherrirose.org/s/TLBCh4Ch5.pdf.
This targeted learning tutorial is free access: academic.oup.com/aje/article/18…. It has steps for double robust machine learning in causal inference and information on calculating standard errors as well as why we want the bias—variance tradeoff for the effect, not the conditional mean.

Happy to answer questions or requests for further resources on machine learning for causal inference. ☺️
If you find this thread after my rotating curator week is over (October 30, 2020), I can be found at @sherrirose.
If you find this thread after my rotating curator week is over (October 30, 2020), I can be found at @sherrirose.

• • •
Missing some Tweet in this thread? You can try to
force a refresh


