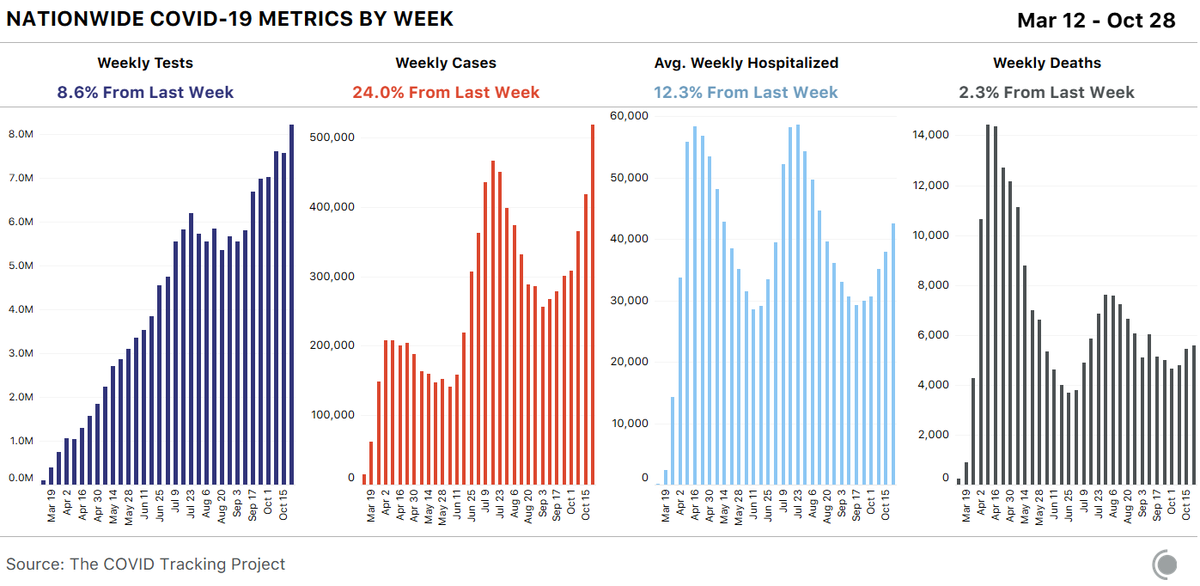
Our weekly update is published. The United States set a new weekly record for reported cases, breaking 500K for the first time in the pandemic. We see no evidence that any state in the current surge has reached its peak and begun to decline.
covidtracking.com/blog/weekly-up…
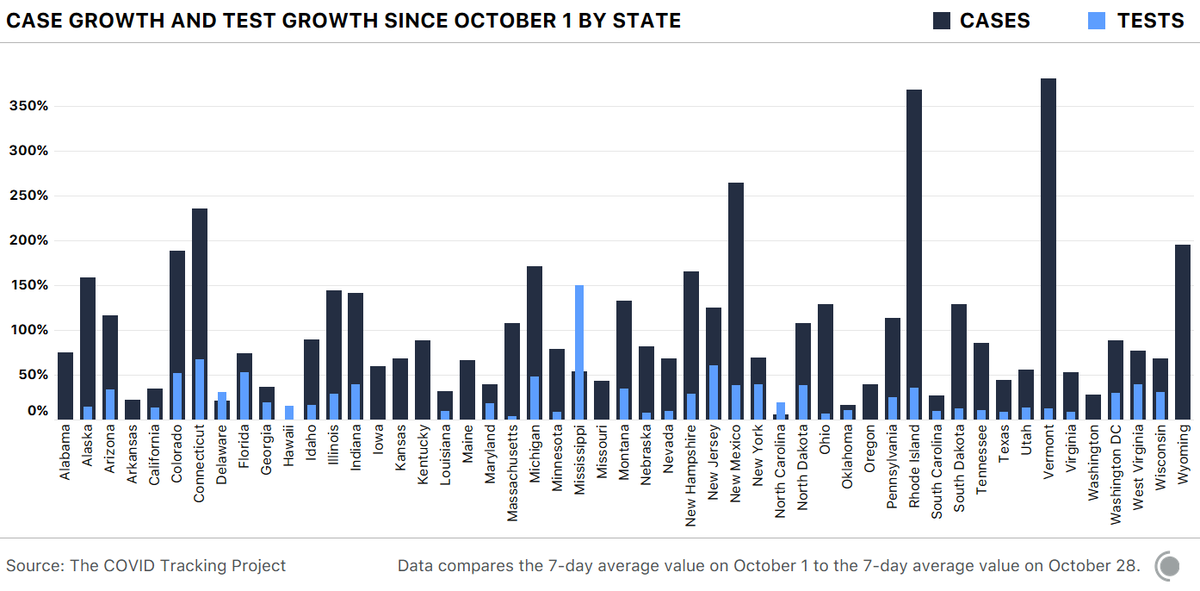
The rise in cases cannot be attributed to an increase in tests; 47 of the 50 states, along with D.C., have seen cases rise faster than reported tests since October 1. 25 states have set records for new cases this week. A bar chart showing case and test growth for the 50 states a
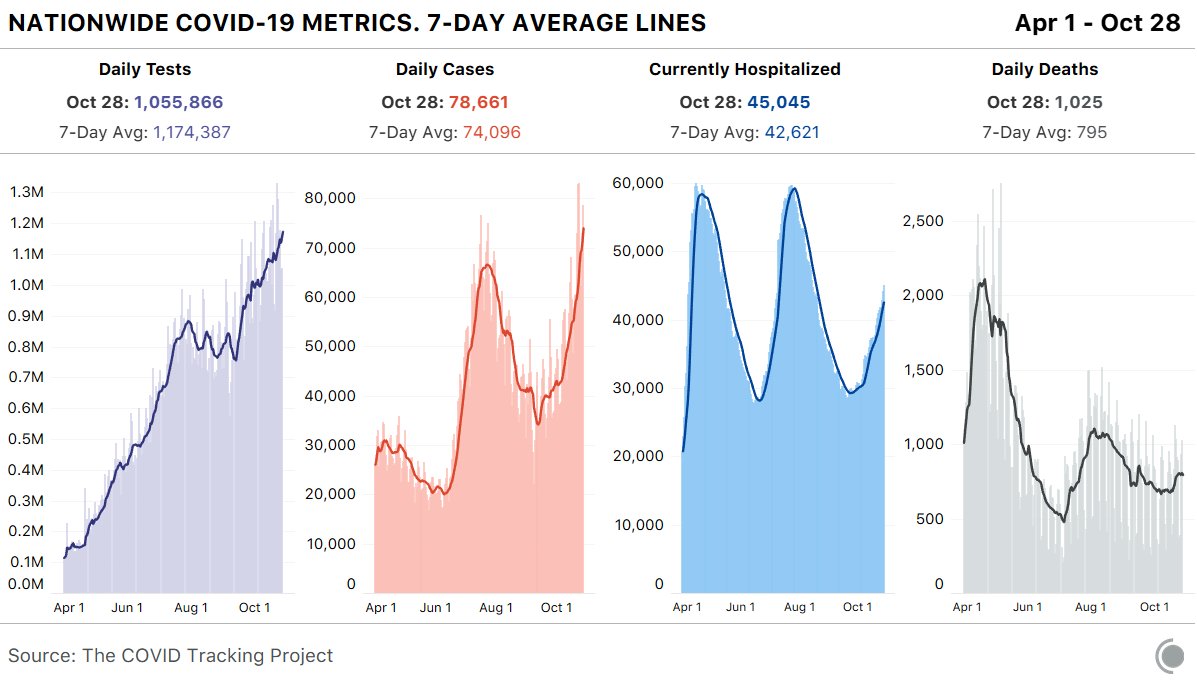
The average number of people hospitalized with COVID-19 rose to 42,621, an increase of about 40% from one month ago. Given the current trends, and what the past has taught us, we should expect deaths to continue to rise in the coming weeks. Four bar charts showing weekly tests (up 8.6%), weekly cases
In some states with worsening outbreaks, the virus has already arrived in nursing homes and other long-term care facilities: Ohio, Wisconsin, and Wyoming have posted record high numbers of COVID-19 cases in these facilities this week.
Less than 1% of the US population lives in long-term care facilities, but deaths among these residents account for 41% of all COVID-19 deaths in the US, and were not restricted to the spring outbreaks. More in our long-term care tracker: covidtracking.com/data/longtermc…

• • •

Missing some Tweet in this thread? You can try to force a refresh
 

Keep Current with The COVID Tracking Project

The COVID Tracking Project Profile picture

Stay in touch and get notified when new unrolls are available from this author!

Read all threads

This Thread may be Removed Anytime!

PDF

Twitter may remove this content at anytime! Save it as PDF for later use!

Try unrolling a thread yourself!

how to unroll video
  1. Follow @ThreadReaderApp to mention us!

  2. From a Twitter thread mention us with a keyword "unroll"
@threadreaderapp unroll

Practice here first or read more on our help page!

More from @COVID19Tracking

29 Oct
Our daily update is published. States reported a record number of cases—88.5k—and 1.3 million tests. 46k people are hospitalized. The death toll was 1049. 4 bar charts showing key CO...
The number of people per capita hospitalized in the Midwest has now surpassed its own spring peak, as well as any time in the West. Image
The per-capita case numbers in the upper Midwest are extremely high. Image
Read 6 tweets
28 Oct
Our daily update is published. States reported 1 million tests, 79k cases, 45k currently hospitalized. The COVID-19 death toll was 1,025 today. 4 bar charts showing COVID-19 metrics for the US. First, tes
Currently hospitalized figures peaked in 13 states today. Map of US showing 13 states (MT, ID, NM, ND, SD, NE, MN, IA,
In the absence of national COVID-19 data standards, the state data we compile is not always comparable. Comparing test positivity across states and territories without considering the unit of the denominator will not yield useful results. We explain here: covidtracking.com/blog/test-posi…
Read 5 tweets
28 Oct
As COVID-19 cases and hospitalizations once again rise across the United States so, inevitably, will deaths. But there is reason to hope that we will not see the devastating fatality rates of the initial spring surge. A brief thread.
Earlier we shared a post highlighting the relationship between cases and hospitalizations. Here we take a closer look at the relationship between hospitalizations and COVID-19 deaths. covidtracking.com/blog/deaths-ar…
In the past week, US states and territories have reported all-time highs in new cases of COVID-19. An alarming trend which we expect to be reflected in hospitalization data. But "another NYC" is far from inevitable.
Read 5 tweets
28 Oct
As COVID-19 cases rise across the United States, claims are circulating that case increases are (mostly or entirely) due to expanded testing, and do not indicate a spike in infections. The data does not support this conclusion. covidtracking.com/blog/cases-mat…
Testing does affect case counts, but testing cannot account for the case surge we’re seeing. Since the beginning of October, the seven-day average for new cases has risen 61% , while tests are only up 14% in the same period.
But cases aren’t the only metric we can use to measure outbreaks. As we’ve seen throughout the year, when COVID-19 cases go up, hospitalizations also rise. The number of patients currently hospitalized with COVID-19 is up 40% since October 1.
Read 4 tweets
27 Oct
Our daily update is published. States reported 1.05 million tests, 73k cases, and 44,212 people hospitalized. The reported death toll was 931. 4 bar charts showing COVID-19 metrics for the US over time.
Only 3 states have seen hospitalizations fall since October 1 (CA, GA, HI). On the left of this image, there is a map of the United Stat
We made a major improvement to our Florida data. We switched our TotalTestResults field to use a newly posted timeseries of testing encounters. This makes FL's data more comparable with other states—and captures a more comprehensive view of FL's testing utilization and strategy.
Read 7 tweets
24 Oct
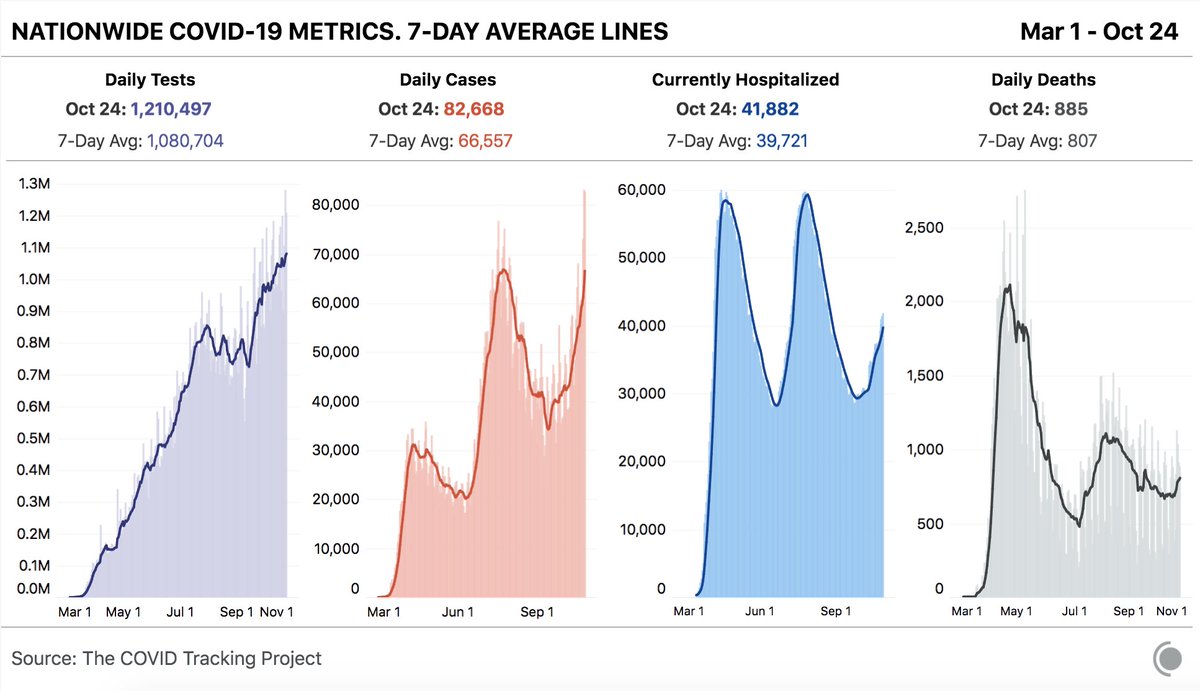
Our daily update is published. States reported 1.2 million tests, 83k cases, 42k currently hospitalized. The death toll was 885 today. 4 bar charts showing COVID-19 metrics for the US over time.
Here is the same data displayed weekly. Tests rose 3.8% from a week ago, while cases are up 20.6%. Deaths also grew by more than 15%.
Cases per million people in the Midwest have surpassed both the early peak in the Northeast and the summer surge in the South.
Read 4 tweets

Did Thread Reader help you today?

Support us! We are indie developers!


This site is made by just two indie developers on a laptop doing marketing, support and development! Read more about the story.

Become a Premium Member ($3/month or $30/year) and get exclusive features!

Become Premium

Too expensive? Make a small donation by buying us coffee ($5) or help with server cost ($10)

Donate via Paypal Become our Patreon

Thank you for your support!

Follow Us on Twitter!