Personal Income:

Interesting trends under the surface of the "surprise" increase in income for September.

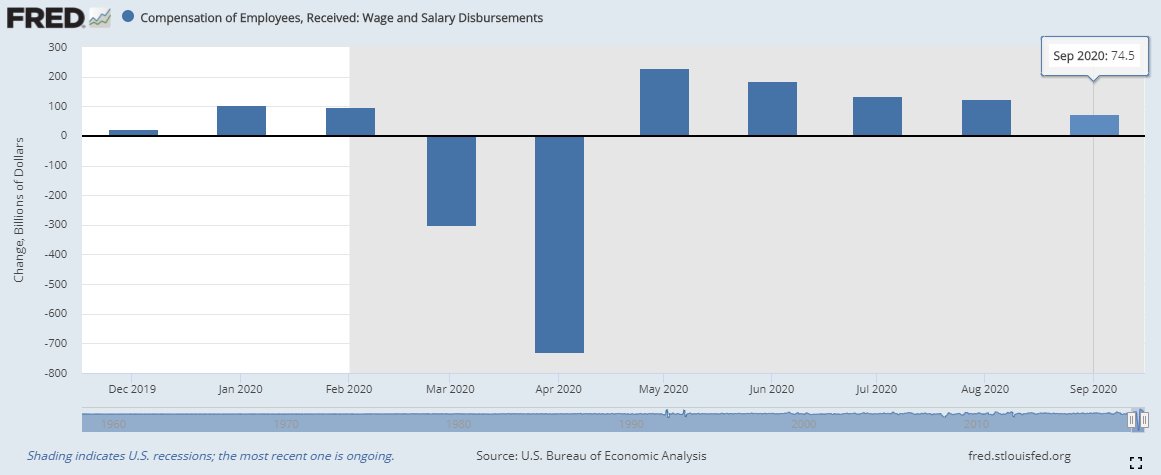
The compensation of employees increased $86B, the smallest increase in five months.

The last five months increase (billions):

$265 > $234 > $157 > $143 > $86
Government transfer payments declined just $5.7 billion.

Last month the decline in transfer payments was ($725) billion.

The delta came from the "other" category of transfer payments.

Last five months of "other":

-$2,019 > -$601 > +$12.5 > -$54.6 > +$247
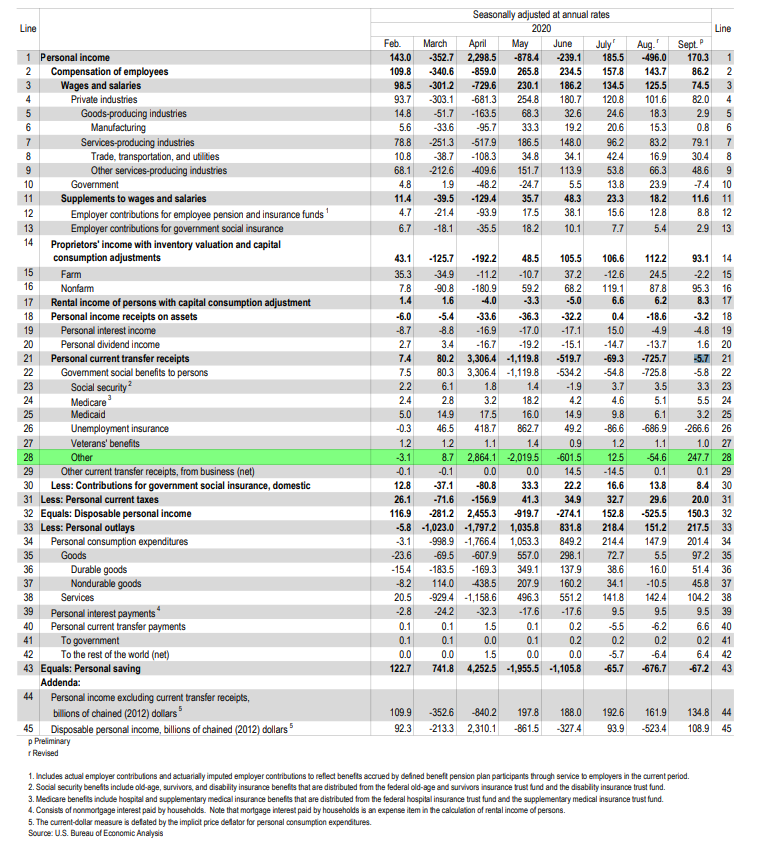
"Other" was boosted by "Lost Wages Supplemental Payments"
Monthly change in wages and salaries:

• • •

Missing some Tweet in this thread? You can try to force a refresh
 

Keep Current with Eric Basmajian

Eric Basmajian Profile picture

Stay in touch and get notified when new unrolls are available from this author!

Read all threads

This Thread may be Removed Anytime!

PDF

Twitter may remove this content at anytime! Save it as PDF for later use!

Try unrolling a thread yourself!

how to unroll video
  1. Follow @ThreadReaderApp to mention us!

  2. From a Twitter thread mention us with a keyword "unroll"
@threadreaderapp unroll

Practice here first or read more on our help page!

More from @EPBResearch

23 Sep
Just read The Menace of Fiscal QE by @GeorgeSelgin

To me, this passage was key: Image
It would seem it comes down to the government expenditure multiplier. If the "fiscal QE" is for a government spending initiative with a positive multiplier, real growth will improve.

At these levels of debt (130%+ of GDP) is there anything that has a positive multiplier?
We have many studies that cut against gov spending at these levels of debt. The Ricardian equivalence works against debt-funded tax cuts in the long run

Based on the research, fiscal QE won't raise the trend rate of real GDP per cap because the gov multiplier is too negative
Read 6 tweets
1 Sep
Some thoughts on growth and inflation

Long-term, structural forces remain in play. Weaker rate of trend growth, more disinflation, and a fall in productivity will come as a result of an unproductive debt overhang

In the short-term, however, we have a pent-up demand rebound

1/n
We can see the rebound clearly in the growth rate of commodities, particularly metals used for industrial processes.

The growth rate in the CRB Metals index has risen to the highest level since 2018 and this is the biggest rebound in growth since the 2016 upturn. Image
Inflation expectations have risen accordingly to the increase in broad baskets of commodities.

Does this growth upturn have legs, or is it more related to a weaker dollar and lower real rates?

3/n Image
Read 9 tweets
27 Aug
Some comments on Powell's Speech:

Is average inflation targeting much different than "symmetrical" inflation?

Seems like new, potentially scarier, language for essentially the same policy.
What new tools will be used that will assure a different outcome relative to the last ten years?

Rates were on hold for 7 years (with a curve that was 300bps wide) and that did not lead to average inflation of 2%.

Now we have 0% ST rates but a curve that's ~60bps wide.
Are we moving to a more objective policy that can be measured with "rules?"

As in, average inflation based on Core PCE over the last 2-years.

If it remains subjective, it's just a hope and a prayer that asset inflation will spur consumption again.
Read 5 tweets
27 Aug
The second release for Q2 GDP was just published. This means we get a look at corporate profits across the entire economy.

Backward-looking for short-term traders. Important information for the long-term impacts on the economy.

Thread on Q2 2020 profit data 👇
Pre-tax corporate profits for the entire economy fell 11% (SAAR) to $1.8 trillion.

This is the lowest level of corporate profits since Q2 2011. Image
After-tax corporate profits fell 12% (SAAR) to ~$1.6 trillion.

This represents the lowest level of after-tax profits since Q1 2014. Image
Read 10 tweets
26 Aug
The US Economy Has An Identity Crisis

The supply of financial capital must equal the demand for financial capital.

seekingalpha.com/article/437086…

1/n
Domestic savings + inflows = domestic investment + government borrowing.

We can rewrite this equation to focus on government borrowing.

Government borrowing = domestic savings + inflows (trade deficit) - domestic investment.

2/n
We know that government borrowing is exploding, so, therefore, for the identity to hold, something on the right-hand side of the equation must change: savings (up), the trade deficit (up), or investment (down).

3/n
Read 9 tweets
19 Aug
Some indications that monetary/credit conditions are tight/tightening again.

First, the monetary base is contracting again, falling $448B

1/5
At banks, cash assets as a % of total assets are falling to ~13% from ~16%. Excluding reserves, cash assets are scarce as a % of total assets.

2/5
Credit aggregates are showing declining growth after the PPP boost. Total loans + nonfinancial commercial paper growth is down from 11% to 5%.

Ex. C&I loans, growth is down from ~7% to ~1%.

3/5
Read 5 tweets

Did Thread Reader help you today?

Support us! We are indie developers!


This site is made by just two indie developers on a laptop doing marketing, support and development! Read more about the story.

Become a Premium Member ($3/month or $30/year) and get exclusive features!

Become Premium

Too expensive? Make a small donation by buying us coffee ($5) or help with server cost ($10)

Donate via Paypal Become our Patreon

Thank you for your support!

Follow Us on Twitter!