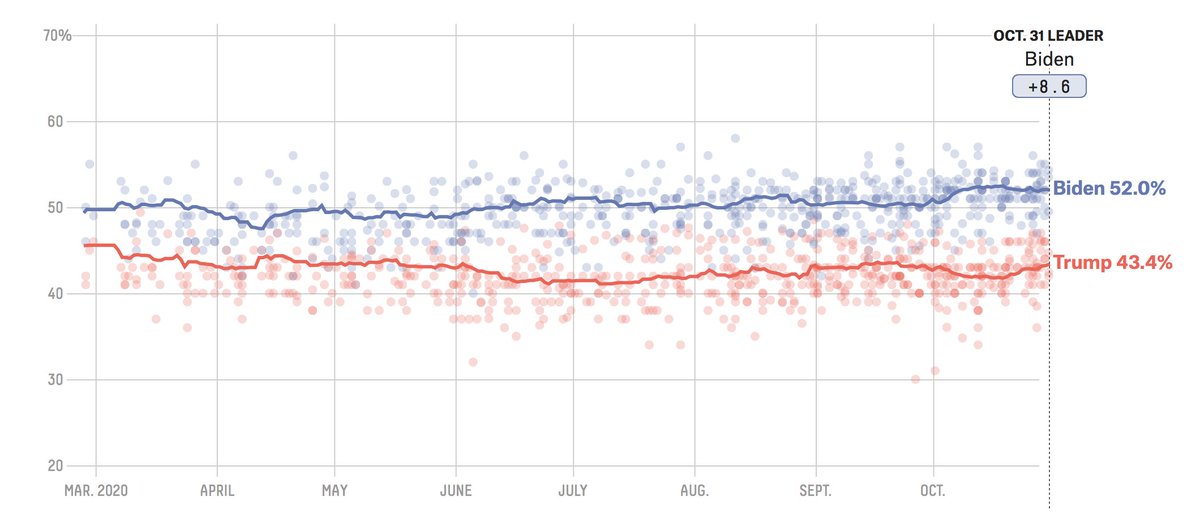
Why is turnout among young Americans so low? @ameliatd, @jazzmyth and I find that while people under 35 *are* more skeptical of the system, they're not apathetic. Instead, they're more likely to face structural barriers like not being able to get off work
(+ bonus charts!) How do we know young people aren't more apathetic? Well, they're not significantly more likely to say they don't vote because the system is too broken, or because they don't believe in voting. But they *are* more likely to say they wanted to vote, but couldn't.
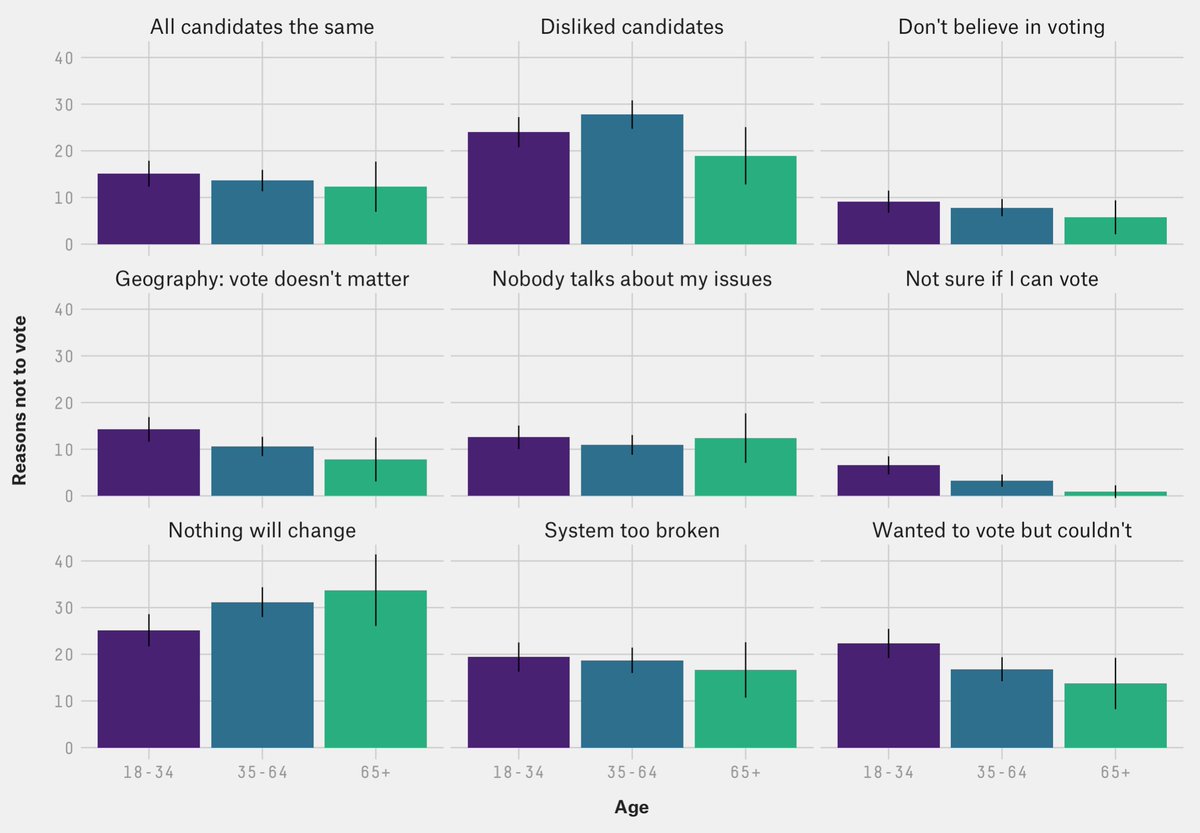
In fact, if anything, young people are *less* likely to say that they don't vote because nothing will change for people like them no matter who wins!
But young Americans are more likely than older Americans to say that changes to government are needed. And they feel less represented: much more say no-one in elected office is like them.
And while all age groups think Republicans are more likely to want people like them *not* to vote than Democrats, that gap is particularly large among young people: 37% say Republicans don't want people like them to vote, compared to 17% for Democrats.
A fascinating stat that didn't make it into the article: young Americans aren't more enamored with army rule or autocracy than older ones, but they are a lot more positive about expert government.
And young people are much less likely than older ones to think that believing in God, displaying the flag, knowing the pledge of allegiance or supporting the military are important to being a good American. But they are more likely to think protesting is.
• • •
Missing some Tweet in this thread? You can try to
force a refresh
Four reasons Biden has a better shot than Clinton did in 2016 -- and 2 reasons there's still uncertainty.
A summary 🧵:
1. Biden's lead is bigger and more stable than Clinton's was.
Clinton's lead was smaller throughout, and more unstable. Biden's has never been < 6.6 points.
2. There are fewer undecideds than 2016.
A week before the 2016 election, around 14% of respondents said they were undecided or intended to vote third party -- and the vast majority of late deciders voted for Trump: 53eig.ht/2fIYJK2
This year, there are much fewer.
3. State polls have improved.
In 2016, it was state polls that had polling errors, in part because they hadn't needed to weight by education before (ft.com/content/b32976…). But polls have improved (53eig.ht/34wDia0), and there are more state polls now.
Vier Gründe, wieso es 2020 um Biden besser steht als 2016 um Clinton -- und zwei Gründe, wieso es trotzdem noch viel Unsicherheit gibt, heute im @derStandardat:
1. Bidens Vorsprung ist größer und stabiler als jener Clintons.
Clintons Vorsprung war durchgehend kleiner und schrumpfte zeitweise auf einen Prozentpunkt; Bidens lag nie unter 6.6 Punkten.
2. Es gibt weniger unentschlossene Wähler als 2016.
Eine Woche vor der Wahl 2016 gab es rund 14% Unentschlossene/Kleinparteienwähler -- und Trump konnte bei genau bei Wählern, die sich spät entschieden, punkten: fivethirtyeight.com/features/why-f…
In short, as the paper explains, looking at use of force just among the set of people police have *stopped* isn't enough to let you correctly estimate racial discrepancies. If there's bias in who gets stopped in the first place, that confounds your estimate.
A simple example: Even assuming use of force among stopped people is equal across race (which is unrealistic), bias in stops means that your denominator is wrong. More Black people have been stopped without cause, so "equal" treatment is actually evidence of discrimination:
2) If you have really noisy data, you could estimate a model to fit it closely, but that's likely to be overfitting (e.g. here, we don't *actually* think deaths are fluctuating so much). So instead, you have to make assumptions about what the data looks like absent the noise.
But those assumptions are important to get a model that fits well out of sample. So this should be guided based on your epidemiological knowledge, your understanding of how the data was collected, and analyses of model fit.
To check for herding, I took the 18 polls released since Aug. 1, and simulated the standard deviation you'd expect based on the polling average and sample sizes. I compared that to the actual standard deviation of the polls, which turned out to be *a lot* smaller.
While the above chart shows the ÖVP, this is true for *all* major parties in Austria; in some cases, the actual standard deviation was less than half of what we'd expect.