Vier Gründe, wieso es 2020 um Biden besser steht als 2016 um Clinton -- und zwei Gründe, wieso es trotzdem noch viel Unsicherheit gibt, heute im @derStandardat:
derstandard.at/story/20001213…
derstandard.at/story/20001213…
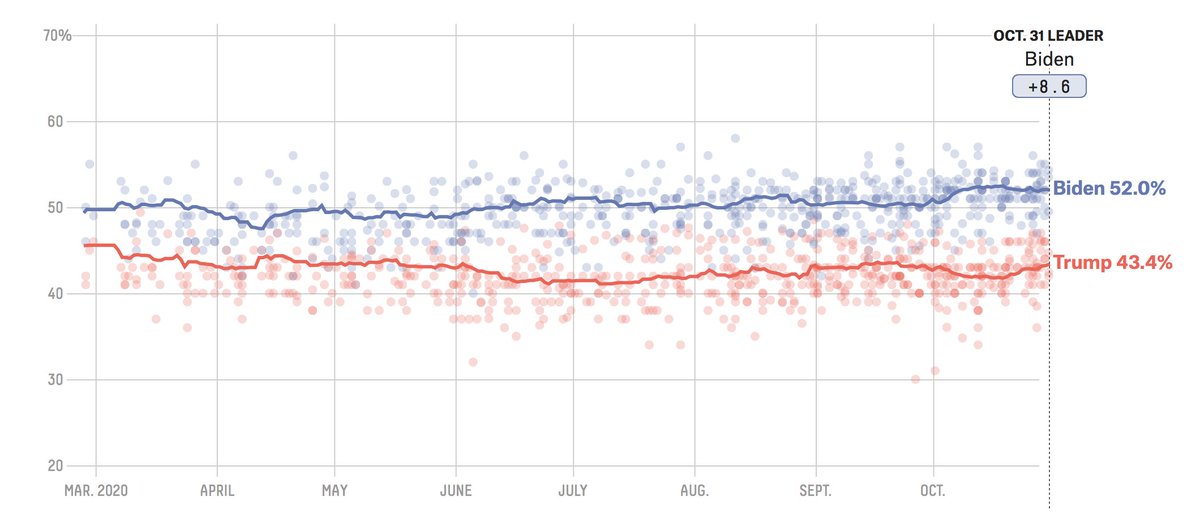
1. Bidens Vorsprung ist größer und stabiler als jener Clintons.
Clintons Vorsprung war durchgehend kleiner und schrumpfte zeitweise auf einen Prozentpunkt; Bidens lag nie unter 6.6 Punkten.
Clintons Vorsprung war durchgehend kleiner und schrumpfte zeitweise auf einen Prozentpunkt; Bidens lag nie unter 6.6 Punkten.


2. Es gibt weniger unentschlossene Wähler als 2016.
Eine Woche vor der Wahl 2016 gab es rund 14% Unentschlossene/Kleinparteienwähler -- und Trump konnte bei genau bei Wählern, die sich spät entschieden, punkten: fivethirtyeight.com/features/why-f…
Diesmal gibt es nur 5% Unentschlossene.
Eine Woche vor der Wahl 2016 gab es rund 14% Unentschlossene/Kleinparteienwähler -- und Trump konnte bei genau bei Wählern, die sich spät entschieden, punkten: fivethirtyeight.com/features/why-f…
Diesmal gibt es nur 5% Unentschlossene.
3. Die Umfragen in den Bundesstaaten sind besser geworden.
2016 lagen nicht die nationalen Umfragen daneben, sondern die in den Bundesstaaten, inklusive in wichtigen Swingstates. Aber Meinungsforscher haben Umfragen verbessert: fivethirtyeight.com/features/what-…
2016 lagen nicht die nationalen Umfragen daneben, sondern die in den Bundesstaaten, inklusive in wichtigen Swingstates. Aber Meinungsforscher haben Umfragen verbessert: fivethirtyeight.com/features/what-…
Sie lagen 2016 in den Staaten übrigens vor allem daneben, weil sie nicht nach Bildung gewichteten -- was vor 2016 nicht nötig war: ft.com/content/b32976…
Außerdem gibt es dieses Jahr einfach *mehr* Umfragen in den Staaten -- Meinungsforscher haben gelernt, wie wichtig die sind.
Außerdem gibt es dieses Jahr einfach *mehr* Umfragen in den Staaten -- Meinungsforscher haben gelernt, wie wichtig die sind.
4. Viele haben schon gewählt.
Mittlerweile haben bereits fast zwei-Drittel so viele Menschen gewählt, wie 2016 insgesamt. Das verringert die Wahrscheinlichkeit, dass etwaige Last-Minute-Überraschungen das Rennen noch stark beeinflussen können.
washingtonpost.com/graphics/2020/…
Mittlerweile haben bereits fast zwei-Drittel so viele Menschen gewählt, wie 2016 insgesamt. Das verringert die Wahrscheinlichkeit, dass etwaige Last-Minute-Überraschungen das Rennen noch stark beeinflussen können.
washingtonpost.com/graphics/2020/…
Zwei Gründe, wieso es doch noch Unsicherheit gibt:
1. Das Coronavirus macht alles komplizierter.
Da anders gewählt wird, ist es schwer Trends zu erfassen. Und ein Anstieg an Covid-19-Fällen könnte bedeuten, dass Menschen die eigentlich noch wählen wollen dies nicht tun.
1. Das Coronavirus macht alles komplizierter.
Da anders gewählt wird, ist es schwer Trends zu erfassen. Und ein Anstieg an Covid-19-Fällen könnte bedeuten, dass Menschen die eigentlich noch wählen wollen dies nicht tun.
2. Um die Spielregeln wird noch gestritten.
zB in Pennsylvania, Minnesota und Texas. Das macht es umso schwerer, die Wahlbeteiligung im Voraus zu schätzen – und kann Menschen vom Wählen abzuhalten, wenn es zu kompliziert erscheint.
fivethirtyeight.com/live-blog/trum…
zB in Pennsylvania, Minnesota und Texas. Das macht es umso schwerer, die Wahlbeteiligung im Voraus zu schätzen – und kann Menschen vom Wählen abzuhalten, wenn es zu kompliziert erscheint.
fivethirtyeight.com/live-blog/trum…
Fazit: die 10%-ige Chance, die Trump dieses Jahr hat, ist wesentlich kleiner als die 29%-ige Chance 2016. Aber Ereignisse mit einer 10-prozentigen Chance passieren in 1/10 Fällen. Es ist also weniger wahrscheinlich -- aber nicht ausgeschlossen.
projects.fivethirtyeight.com/2020-election-…
projects.fivethirtyeight.com/2020-election-…
• • •
Missing some Tweet in this thread? You can try to
force a refresh