* Presumably we'll get some YouGov/CBS in 10 minutes here.
* Emerson's releasing polling all day.
* Monmouth in PA.
* Rumors of another round of Fox News state polls, though I'm not 100% sure about those.
* NBC/Marist hasn't released a PA poll this round so that may be coming.
* Presumably Quinnipiac has something up its sleeve?
* A handful of one-off state polls from local universities/newspapers may weigh in again, but they can be budget-constrained and timing hard to predict.
* Morning Consult has mostly been keeping its state polls paywalled, don't know if we'll get something public.
* Maybe one more round of Ipsos state polls?
Of course we'll get weird/random stuff too, a lot of which will probably herd, but this is ~the list of polls I care about.
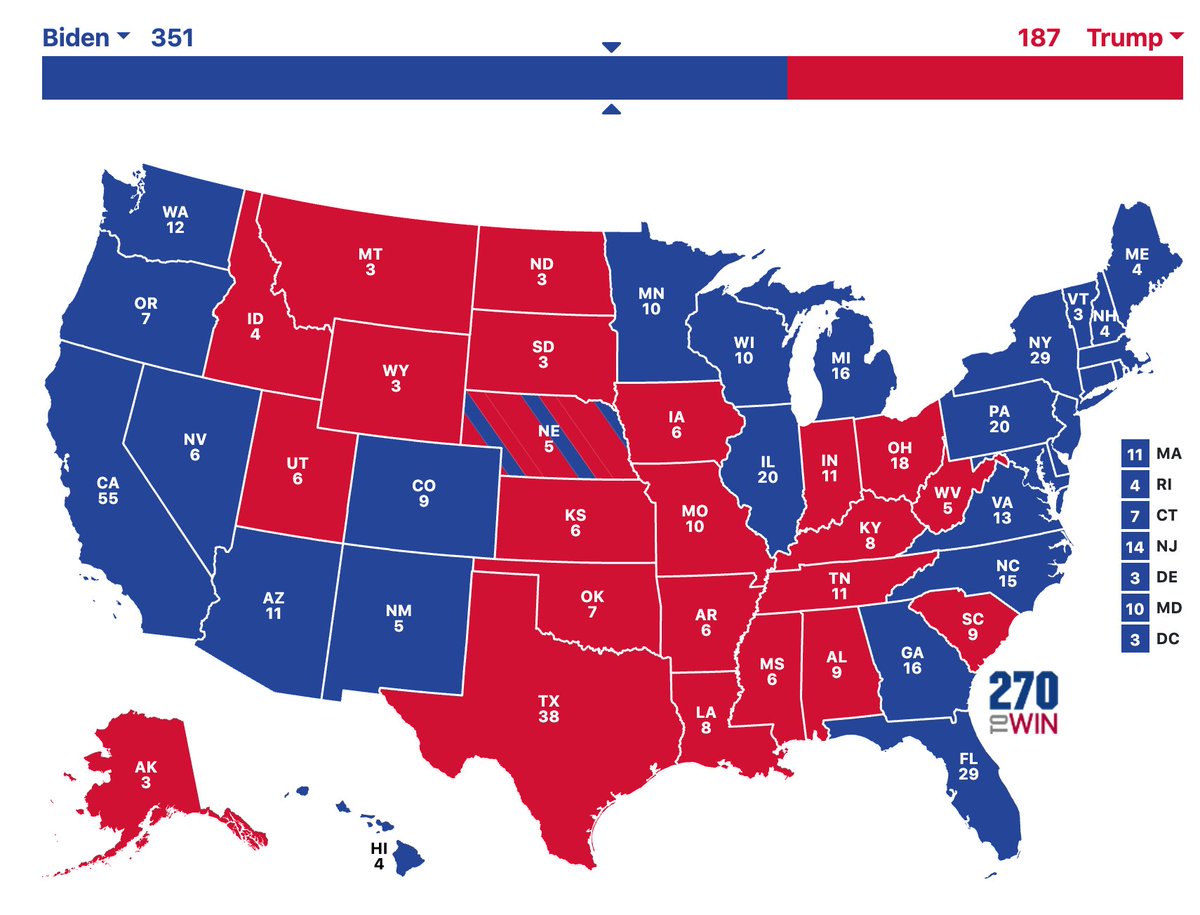
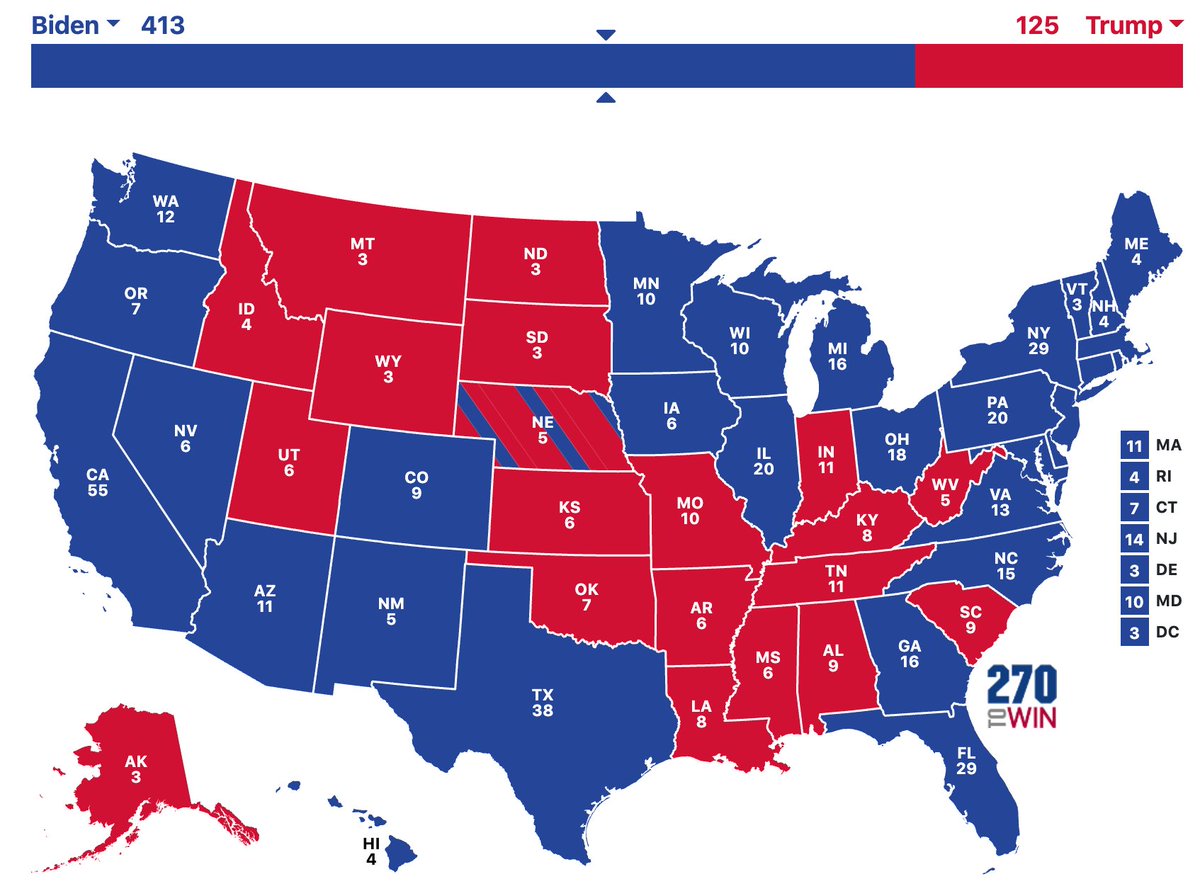
Well, it looks like from YouGov/CBS, we got modeled *forecasts* rather than new polling per se. It's a cool product but we can't use these in our own forecasts as we are averaging polls and not averaging other people's forecasts.
At the end here, our model defaults to a very "polls-only" forecast. So here's our version of a "no tossups" map based on final polling average in each state. Very unlikely that all of these turn out right as NC, ME-2, GA, OH, IA, TX all within 2 points.
If Biden beats his forecast by 3 points nationally, here's the map you wind up with instead, with OH, IA and TX flipping blue.
So... this is a special morning for our forecast in that there's now no more time until the election. (The model treats Election Day and Election Eve as equivalent to one another.) This has a couple of minor effects.
1. The forecast is now totally polls-based; there's no longer any prior for economics/incumbency. The weight assigned to this prior had been declining anyway so that it was close to zero, but now it's actually zero.
2. One type of uncertainty—"drift", or how much polls change between the present day and the election—is also now gone. Of course, there's still the chance that polls could be *wrong*. But there's no longer time for polls to change (though a few more will straggle in today.)
1. In the course of our reporting on Trafalgar Group—part of the due diligence we often do while entering polls—we've learned that some of their polling was done for partisan clients that weren't clearly disclosed.
2. This doesn't neatly fit into any of our current policies, although it goes against the transparency that we generally ask of pollsters.
3. It's important to know the sponsor/client for many reasons, including that our averages handle partisan/internal polls slightly differently: fivethirtyeight.com/features/our-n…
I'm not sure that some of these early-voting comparisons to 2016 make a ton of sense given that much of Biden's edge is thought to come from independents breaking his way, and early voting statistics won't capture that.
For example, Biden lost independents by 13 points in Nevada in 2016, per the exit poll there. This year, he leads them by 3 points, in an average of the last 6 polls of the state. That amounts to a net 6 point swing to Biden.
In many state/national polls, Biden also gets a slightly higher share of Republicans than Trump does of Democrats. In Nevada polls, for instance, Trump gets 6% of Democrats but Biden gets 9% of Republicans. That's amounts to about a 2 point swing to Biden vs. 2016.
I would note that the gap is a little bit narrower in our *forecast*: Biden +5.1 in Pennsylvania vs. +7.8 in the national popular vote. projects.fivethirtyeight.com/2020-election-…
Why is Biden +9.1 in our national poll average but +7.8 in our forecast?
* The forecast still assumes just a teensy bit of tightening (about 0.4 points toward Trump)
* The forecast is mostly based on state polls, which have been more consistent with an ~8 point lead than 9-10.
Why this state/national poll gap exists is an interesting question. Also there have been points in the year where it seemed to run in the opposite direction, e.g. before the first debate, our model thought Biden led by ~8 points from state polls vs. a ~7 point national poll lead.
I think there are basically 3 groups of polls that herd.
1) Some (certainly not most or all) online or IVR polls with crappy raw data seem to look to live-caller polls for guidance. They tend to stay pretty close to the averages throughout the year.
2. Some partisan and quasi-partisan pollsters seem to play a lot of games with the 538 and RCP averages. They don't want to stray *too* far from the average, but they'll often show results that are like the 538 or RCP average shifted by 2 points toward their side.
3. Some high-prestige academic and media pollsters may be scared to publish a perceived outlier very late in the race, when they think it could hurt their reputation. For most of the year, these pollsters are the ones you trust NOT to herd. But sometimes their final polls are 🤔.