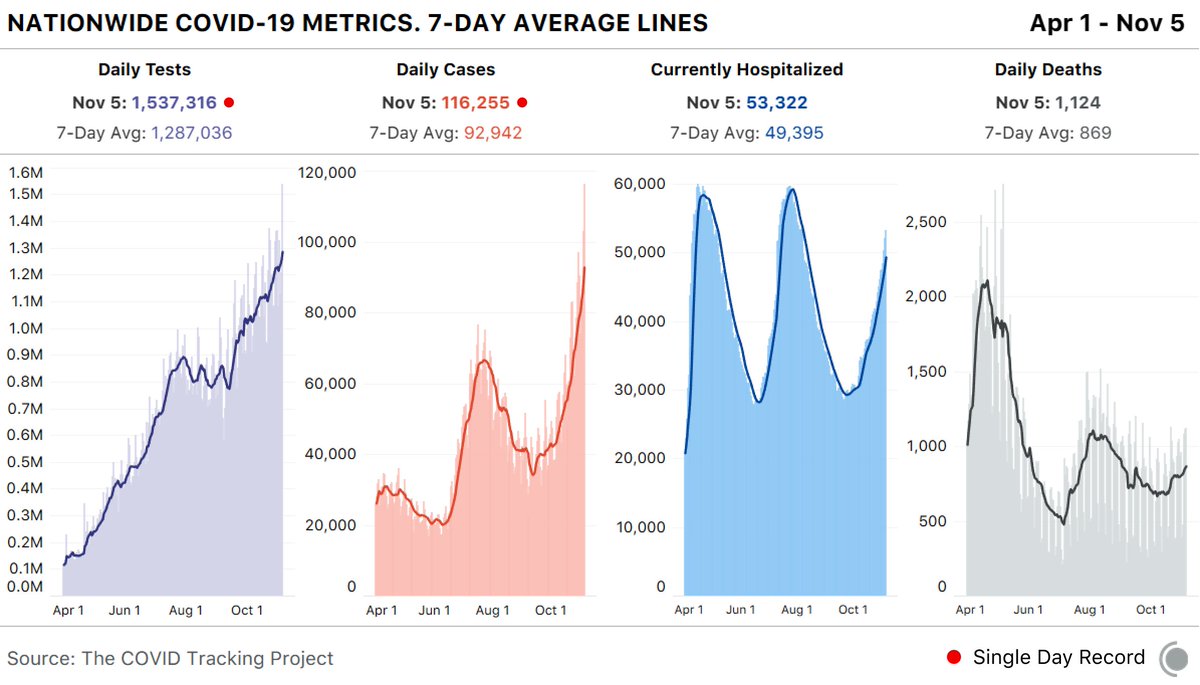
Our daily update is published. States reported 1.2 million tests and 103k cases - the highest daily case count to date. 52k people are currently hospitalized with COVID-19 and today’s death toll was 1,116. 4 bar charts showing COVID-19 metrics for the US over time.
There are 34 states reporting over 1,000 cases — a new record.
Hospitalization numbers peaked in 16 states today. 20 states have over 1,000 people currently hospitalized with COVID-19.
Two data changes in Georgia: GA has added 30,829 “antigen positive cases” to their totals. We asked for clarification on how we should account for these positive tests. In the meantime, we recorded these positive antigen tests in our “Positive Antigen Tests (People)” API field.
Georgia also began reporting probable deaths on Nov 3, so the 480 GA deaths now in our data for Nov 3 include ~450 previously recorded probable deaths. These deaths are reflected in the historical data and not in today's national update.

• • •

Missing some Tweet in this thread? You can try to force a refresh
 

Keep Current with The COVID Tracking Project

The COVID Tracking Project Profile picture

Stay in touch and get notified when new unrolls are available from this author!

Read all threads

This Thread may be Removed Anytime!

PDF

Twitter may remove this content at anytime! Save it as PDF for later use!

Try unrolling a thread yourself!

how to unroll video
  1. Follow @ThreadReaderApp to mention us!

  2. From a Twitter thread mention us with a keyword "unroll"
@threadreaderapp unroll

Practice here first or read more on our help page!

More from @COVID19Tracking

6 Nov
Our daily update is published. States reported record numbers of tests (1.5 million) and cases (116k). Hospitalizations continue their sharp rise. The death toll was 1,124. 4 bar charts showing key US...
37 states reported over 1000 cases. A cartogram showing the num...
North Dakota hit over 2,000 cases per million today, a record in our data for any state.

Many states have set new record highs for cases in the last week. A bubble chart showing when...
Read 9 tweets
3 Nov
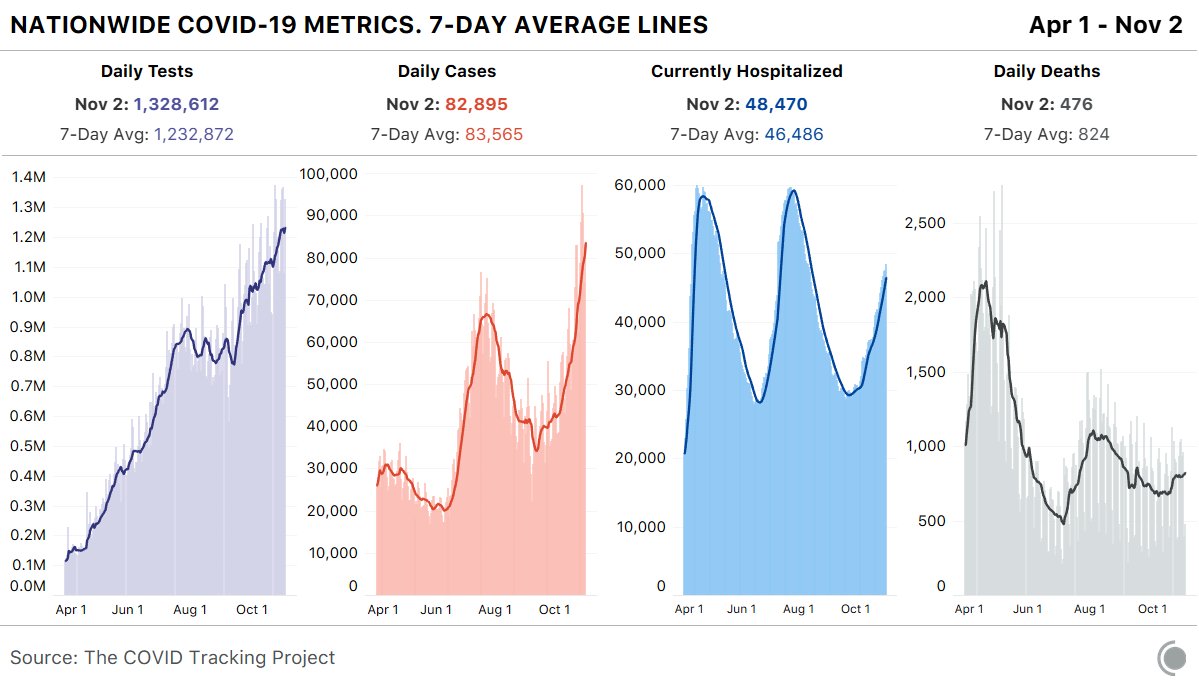
Our daily update is published. States reported 1.3 million tests and 83k cases. 48k people are currently hospitalized with COVID-19. Today's death toll was 476. 4 bar charts showing COVID-...
The outbreak in the midwest continues to outpace detected cases in the Northeast and South. There are now 478 cases per million people in the region. Chart showing 7-day average...
The new 7-day average for cases is above 80k. This figure has increased by 10k each week for the last 3 weeks. Image
Read 5 tweets
2 Nov
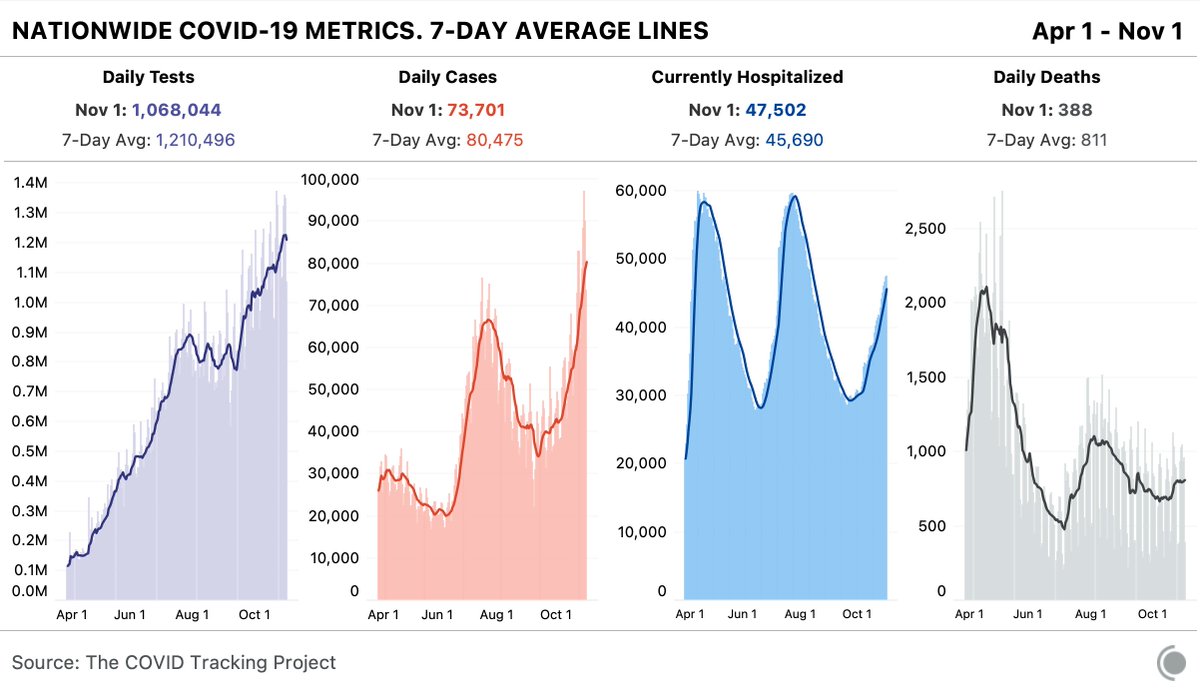
Our daily update is published. States reported 1.1 million tests and 74k cases, almost 10k more than last Sunday. 48k people are currently hospitalized with COVID-19. Today's death toll was 388. 4 bar charts showing COVID-19 metrics for the US over time.
Today, Arkansas did not update any of its metrics except for hospitalization figures. In addition, Minnesota has not updated its hospitalizations and ICU figures since Thursday.
South Dakota reported 1,506 new cases per million people, surpassing North Dakota's count. The Dakotas have had the highest counts for this metric for more than two months now. Cartogram map showing new cases per million people by state
Read 4 tweets
29 Oct
Our daily update is published. States reported a record number of cases—88.5k—and 1.3 million tests. 46k people are hospitalized. The death toll was 1049. 4 bar charts showing key COVID-19 metrics for the US. First,
The number of people per capita hospitalized in the Midwest has now surpassed its own spring peak, as well as any time in the West.
The per-capita case numbers in the upper Midwest are extremely high.
Read 6 tweets
29 Oct
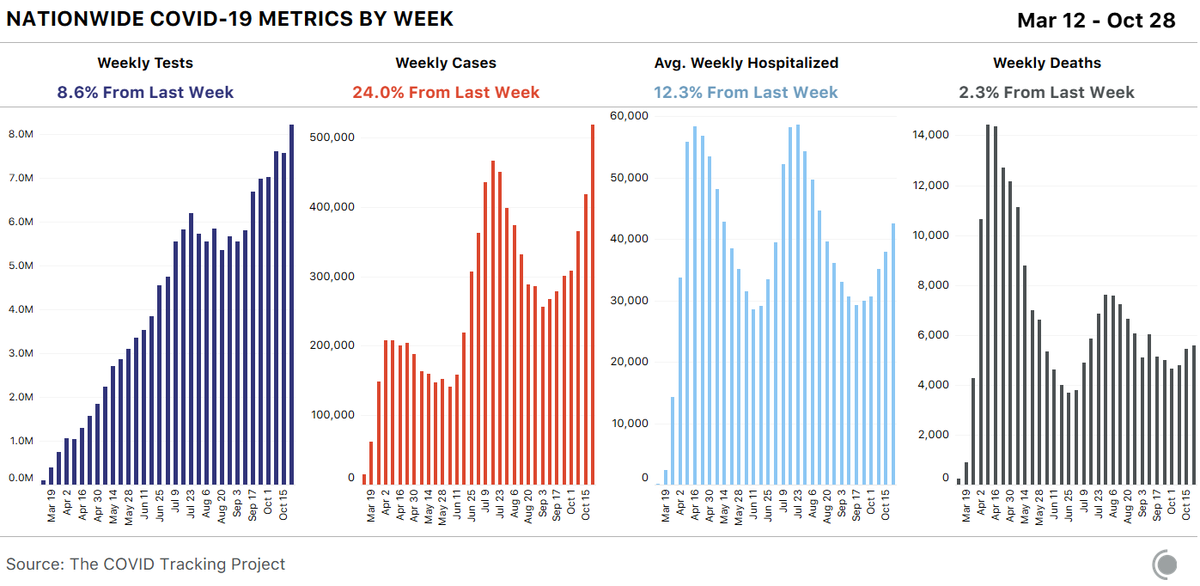
Our weekly update is published. The United States set a new weekly record for reported cases, breaking 500K for the first time in the pandemic. We see no evidence that any state in the current surge has reached its peak and begun to decline.
covidtracking.com/blog/weekly-up…
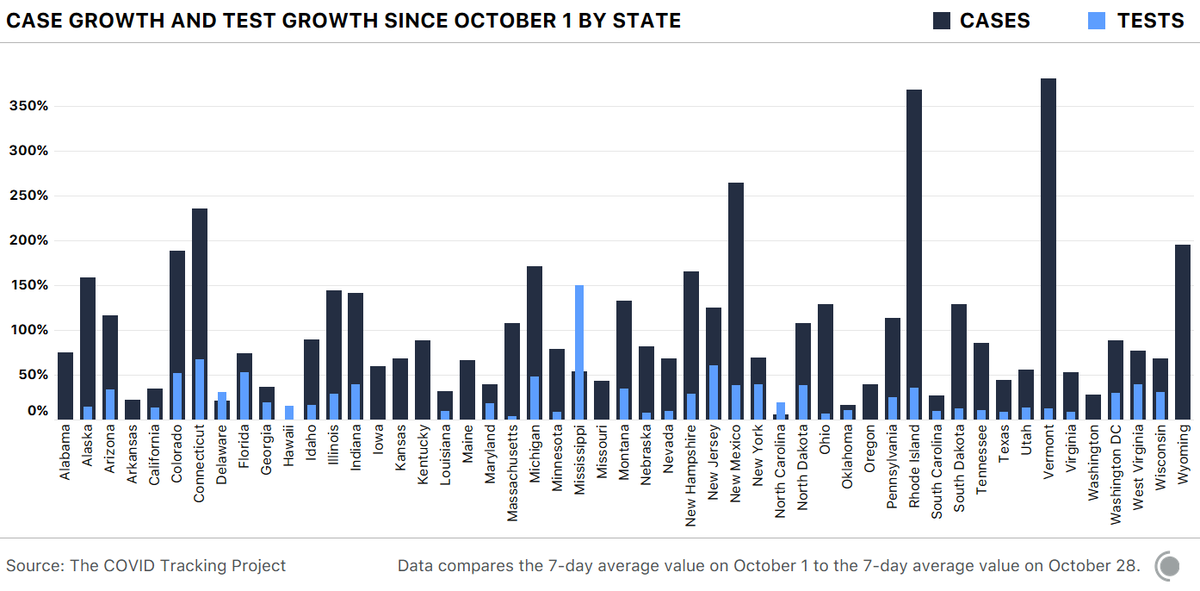
The rise in cases cannot be attributed to an increase in tests; 47 of the 50 states, along with D.C., have seen cases rise faster than reported tests since October 1. 25 states have set records for new cases this week. A bar chart showing case and test growth for the 50 states a
The average number of people hospitalized with COVID-19 rose to 42,621, an increase of about 40% from one month ago. Given the current trends, and what the past has taught us, we should expect deaths to continue to rise in the coming weeks. Four bar charts showing weekly tests (up 8.6%), weekly cases
Read 5 tweets
28 Oct
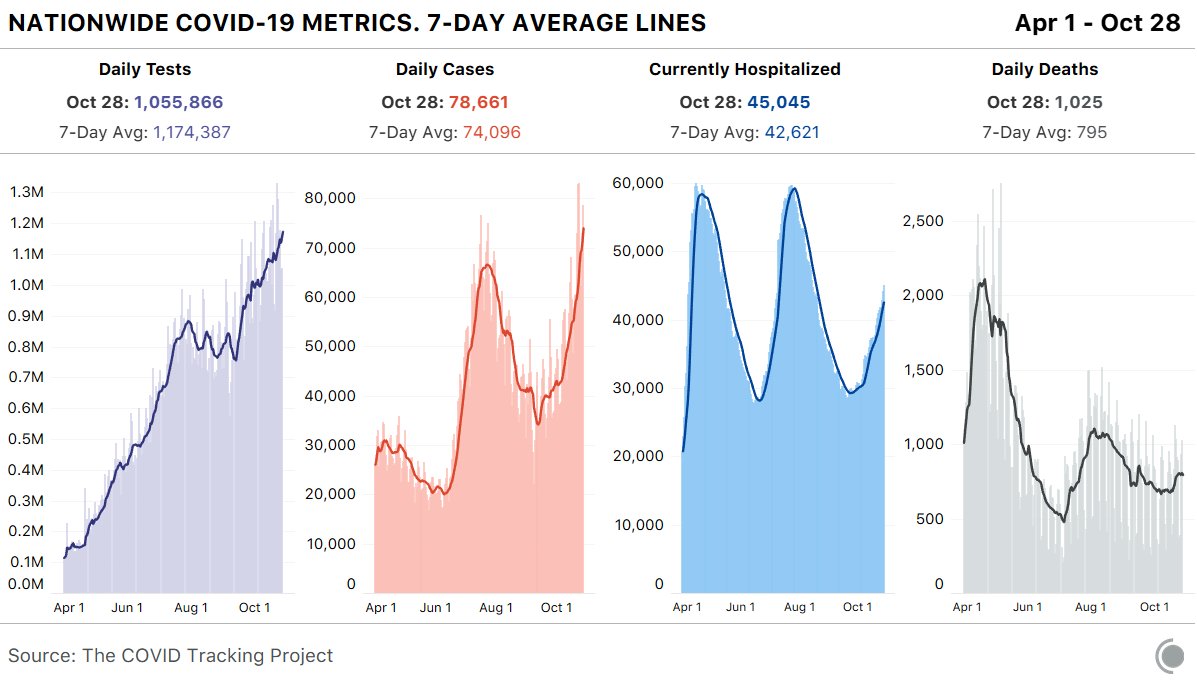
Our daily update is published. States reported 1 million tests, 79k cases, 45k currently hospitalized. The COVID-19 death toll was 1,025 today. 4 bar charts showing COVID-19 metrics for the US. First, tes
Currently hospitalized figures peaked in 13 states today. Map of US showing 13 states (MT, ID, NM, ND, SD, NE, MN, IA,
In the absence of national COVID-19 data standards, the state data we compile is not always comparable. Comparing test positivity across states and territories without considering the unit of the denominator will not yield useful results. We explain here: covidtracking.com/blog/test-posi…
Read 5 tweets

Did Thread Reader help you today?

Support us! We are indie developers!


This site is made by just two indie developers on a laptop doing marketing, support and development! Read more about the story.

Become a Premium Member ($3/month or $30/year) and get exclusive features!

Become Premium

Too expensive? Make a small donation by buying us coffee ($5) or help with server cost ($10)

Donate via Paypal Become our Patreon

Thank you for your support!

Follow Us on Twitter!