BREAKING: LATEST MORTALITY DATA (released yesterday)

See below for my updated and extended charts, and a few new ones. πŸ‘‡πŸ‘‡πŸ‘‡

There's a clear trend towards improving annual mortality, and no evidence of any impact from Covid.

Please share: everybody needs to know this!
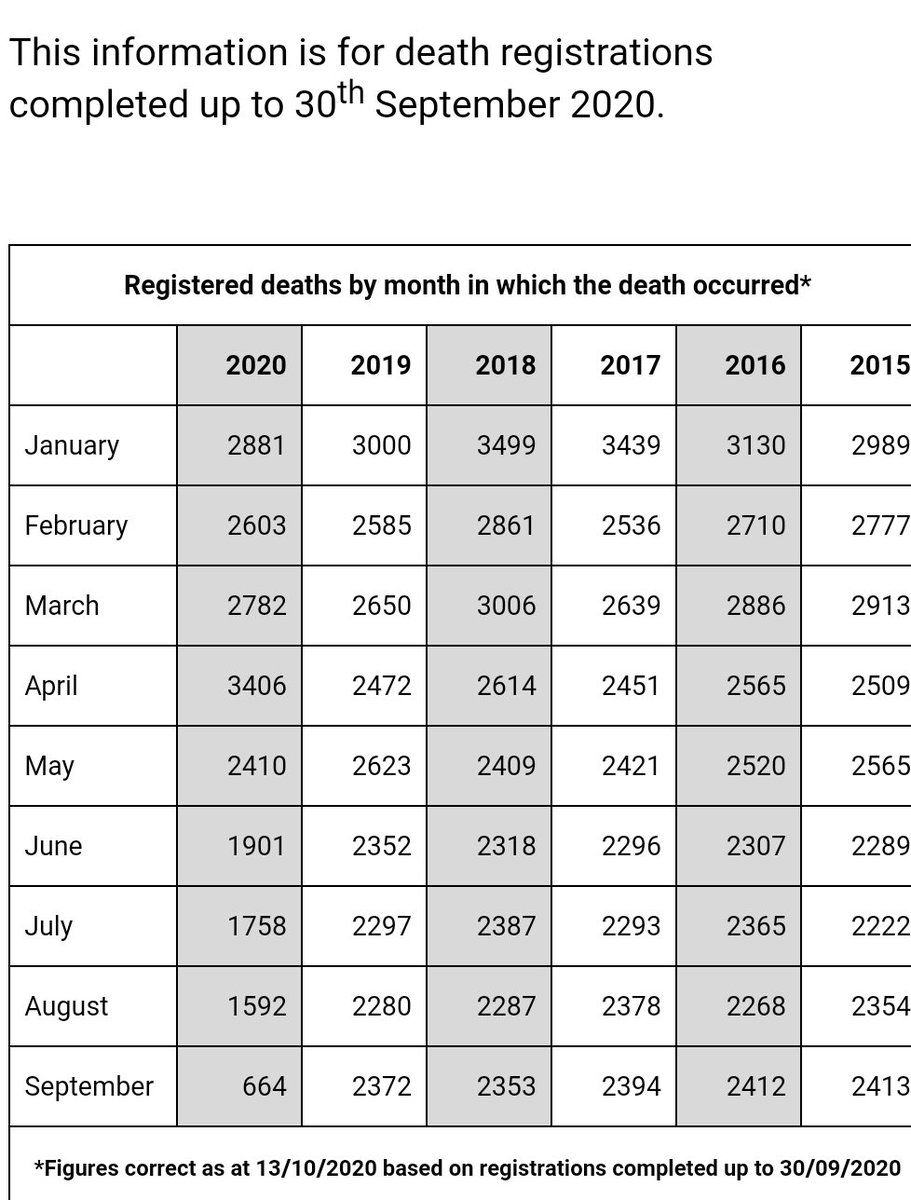
Here's the raw data.

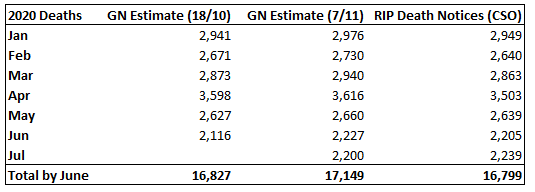
I've updated my estimates for the first half of the year, including all late registrations.

I've been deliberately pessimistic, and my pessimistic esimates are what you will see in the charts below.
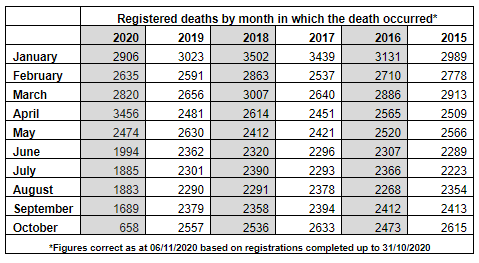
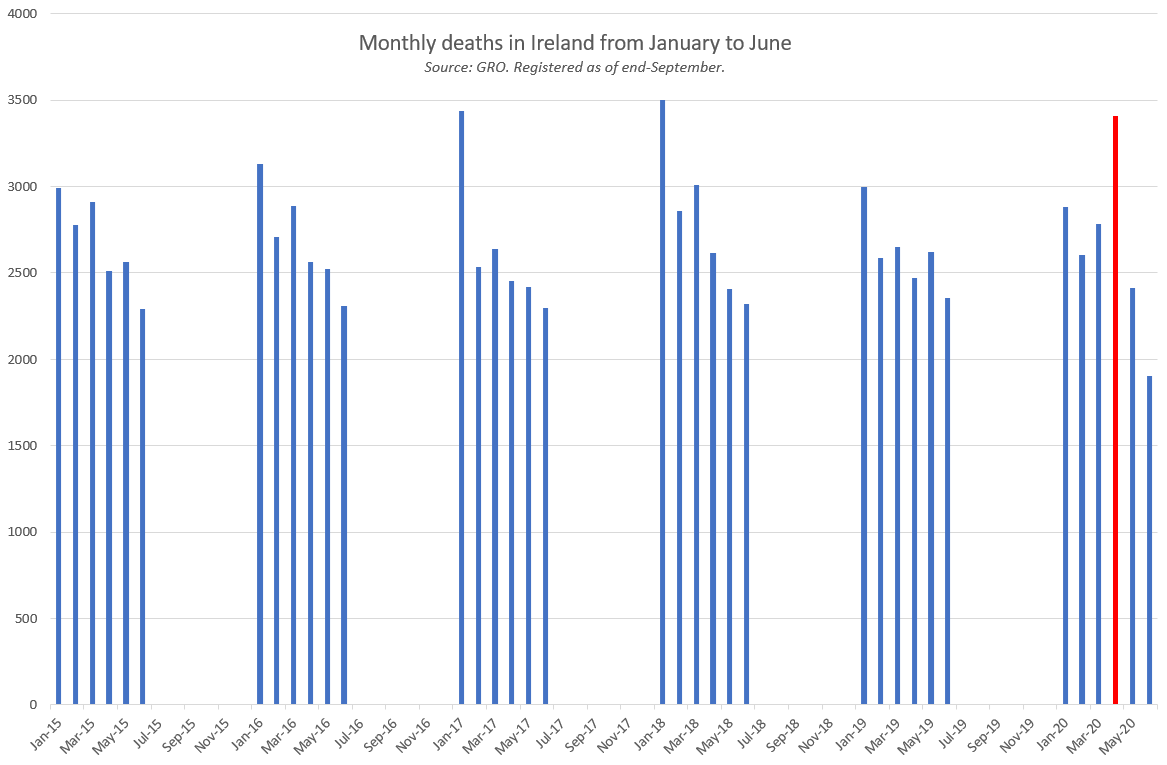
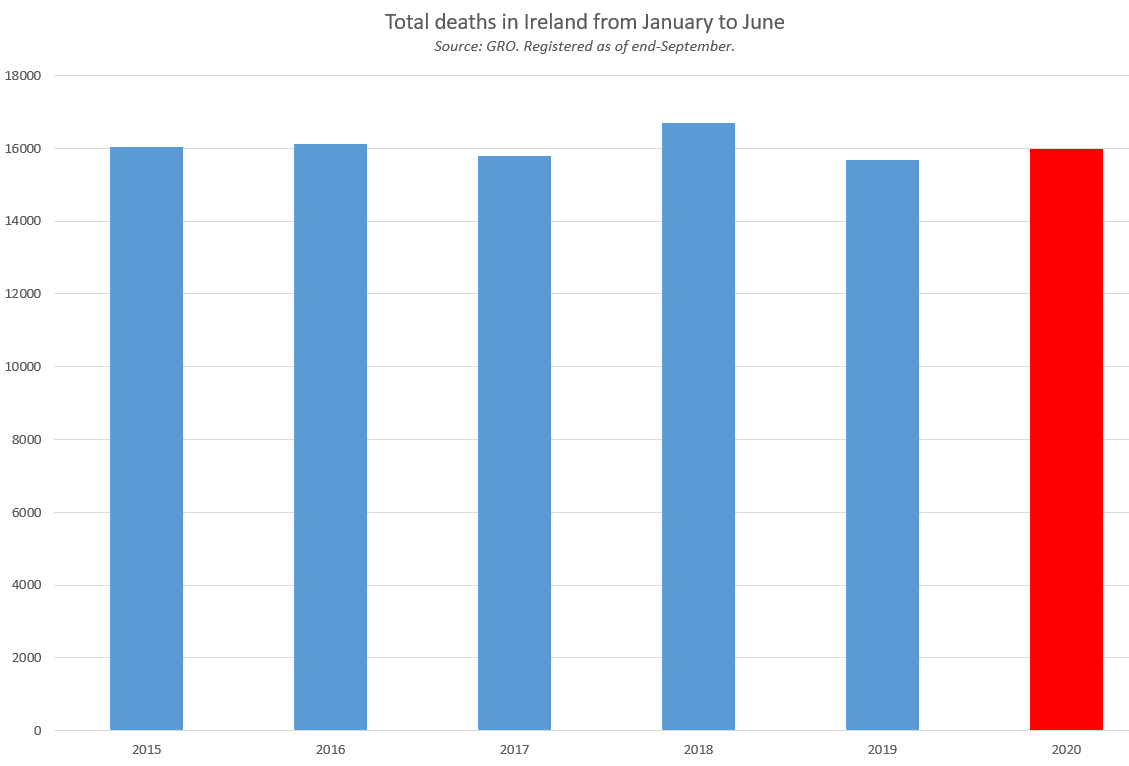
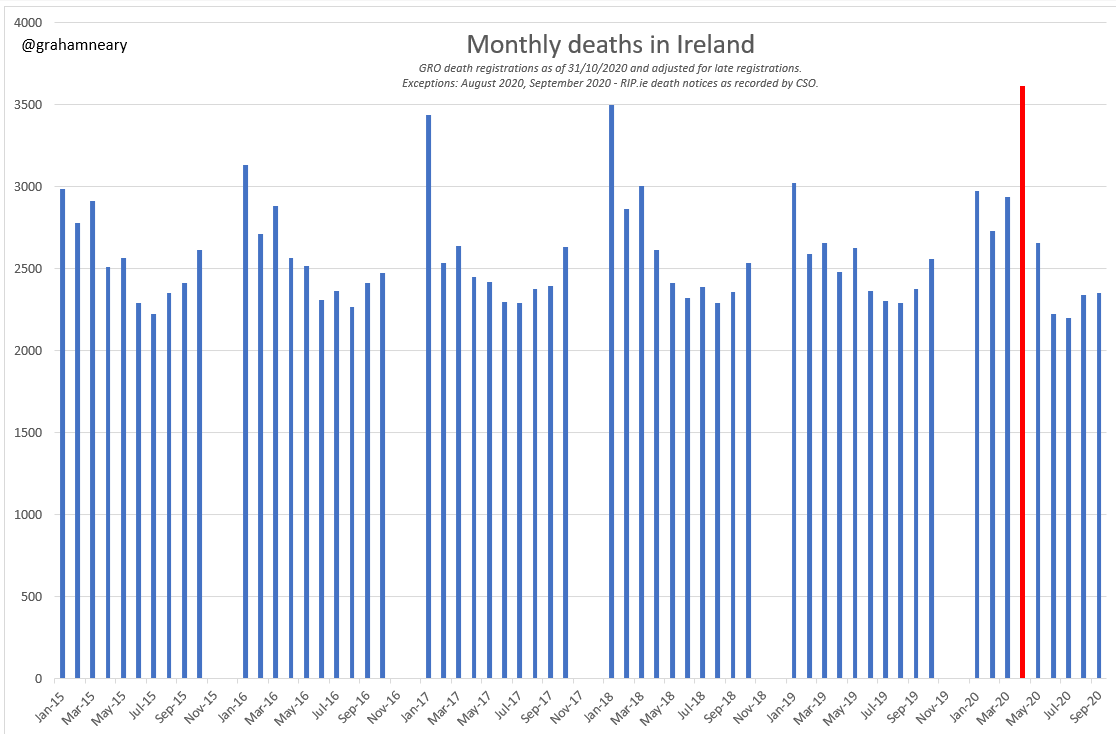
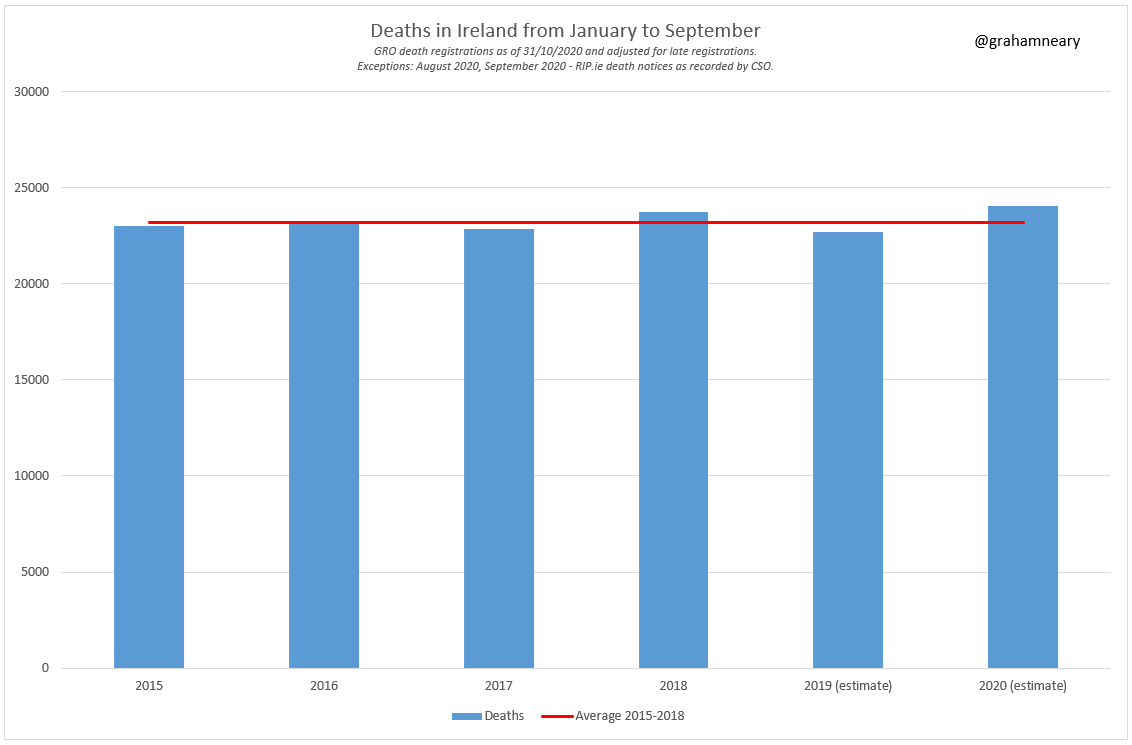
First up, here are monthly registrations and the total from January to September.

April 2020 is the worst of all the months in my dataset.

And 2020 is 3.6% higher than an average year.

But the story is only beginning.
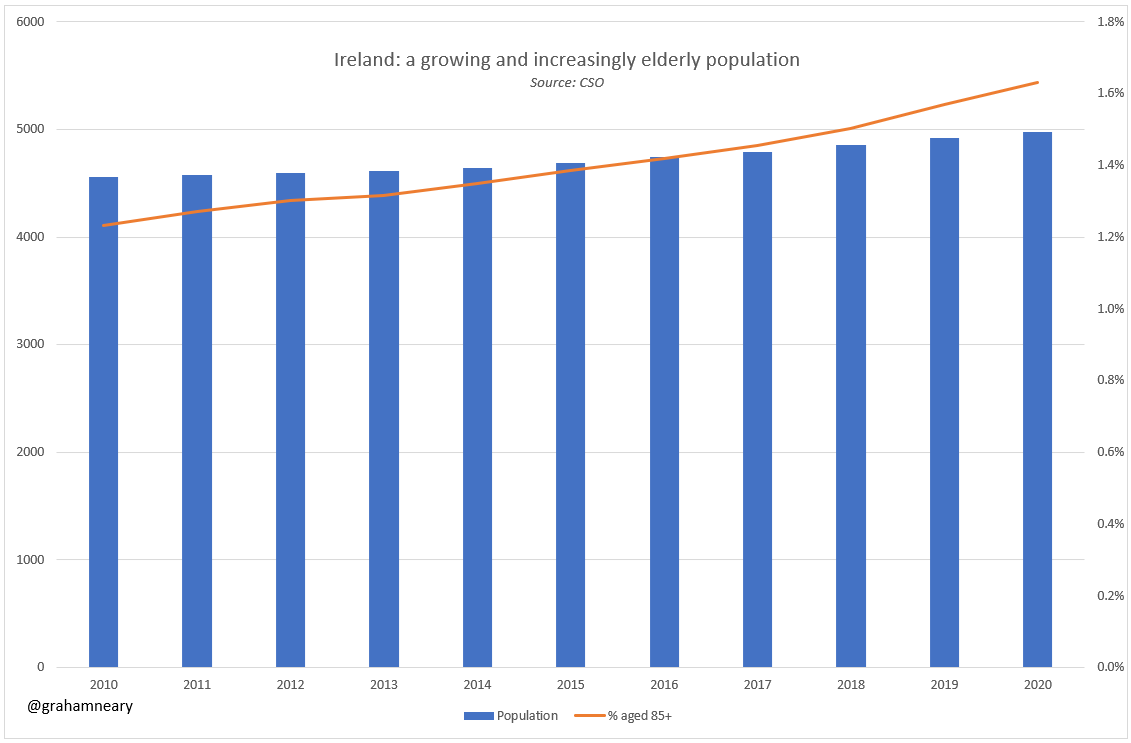
Because the population is both growing and getting older.

Over the last five years alone, the number of people aged 85+ grew by a massive 25%.

A larger, more elderly population will tend to have higher mortality than a smaller, younger population.

We have to adjust for this.
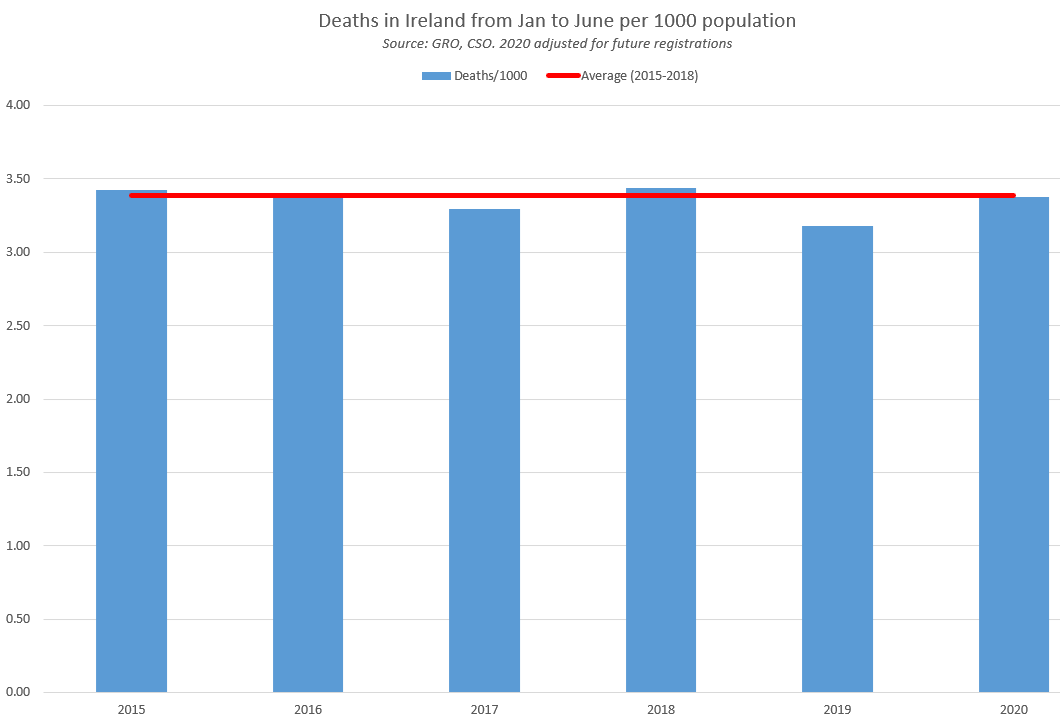
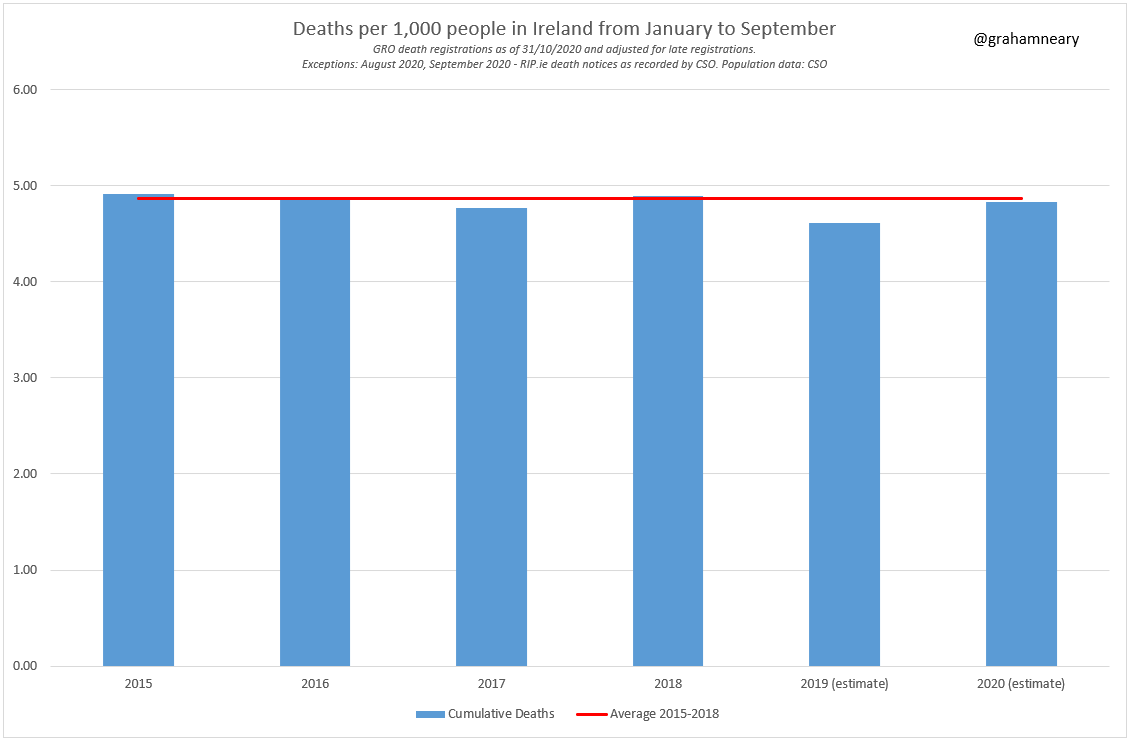
Adjusting for population size is simple.

When I do this, April 2020 becomes only as bad as a "harsh winter flu" type of month.

And 2020 comes in slightly below average - safer than three of the previous five years.

Why isn't mainstream media telling this story?
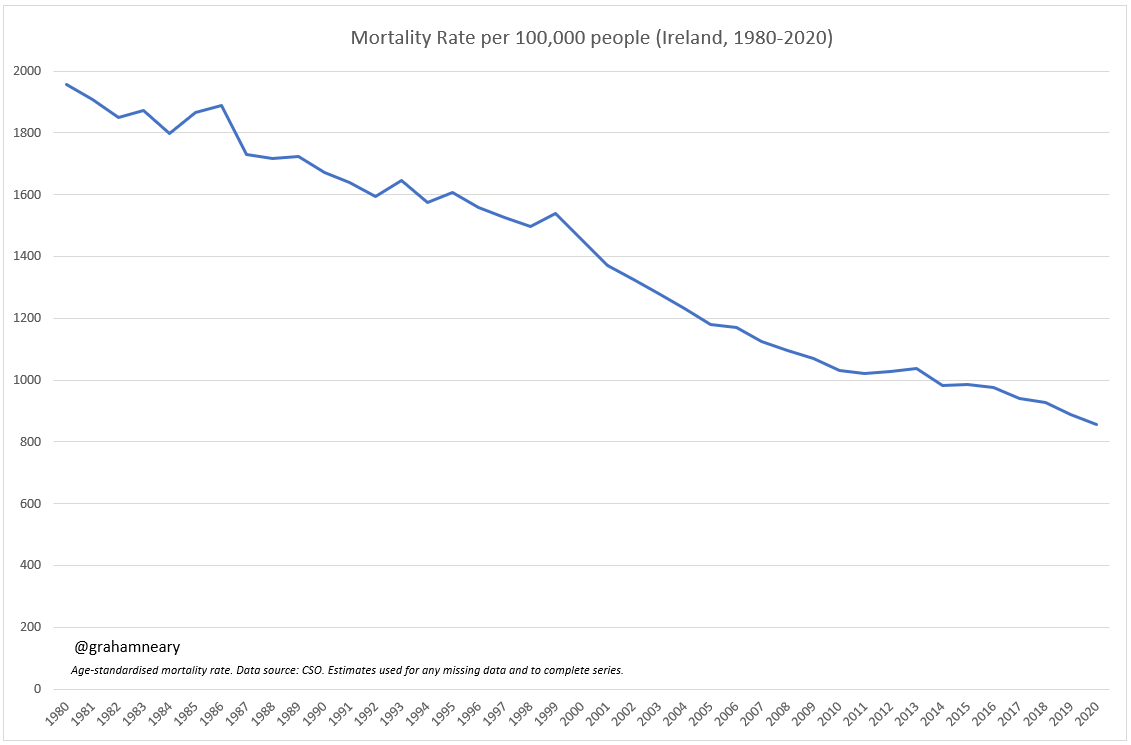
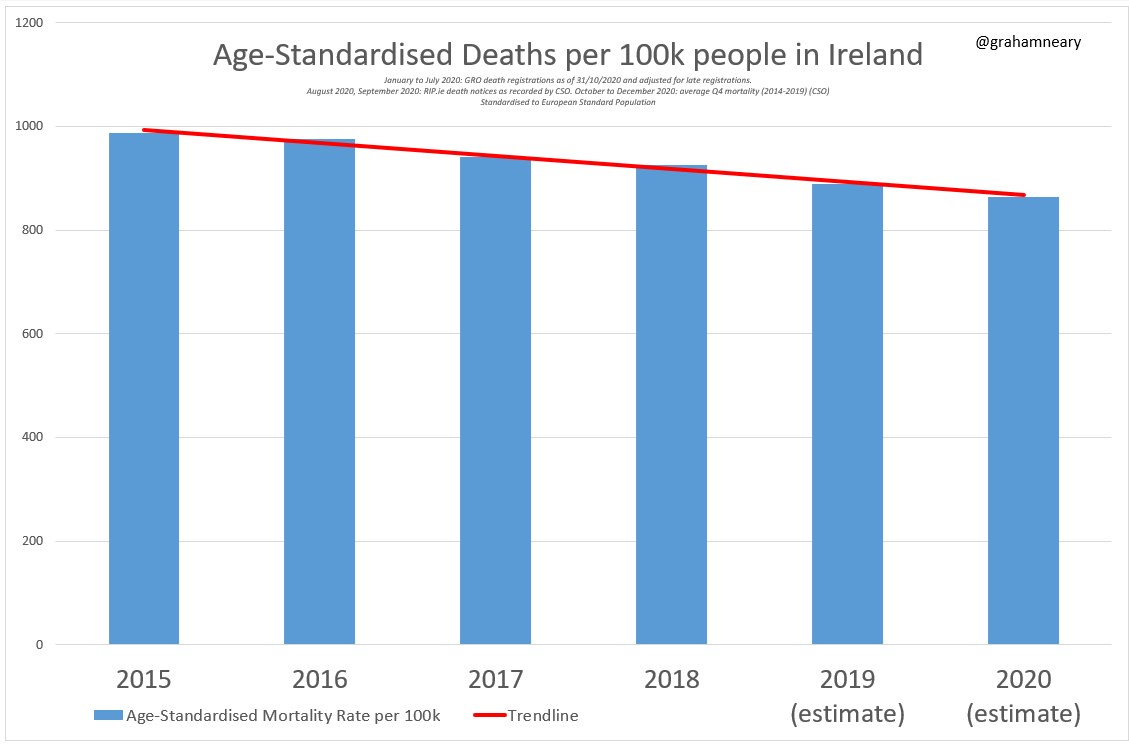
When I adjust for age and make a 2020 forecast, assuming that Q4 is normal, the results are even more amazing.

The numbers all point to 2020 being a normal year - in truth, probably the safest year ever!

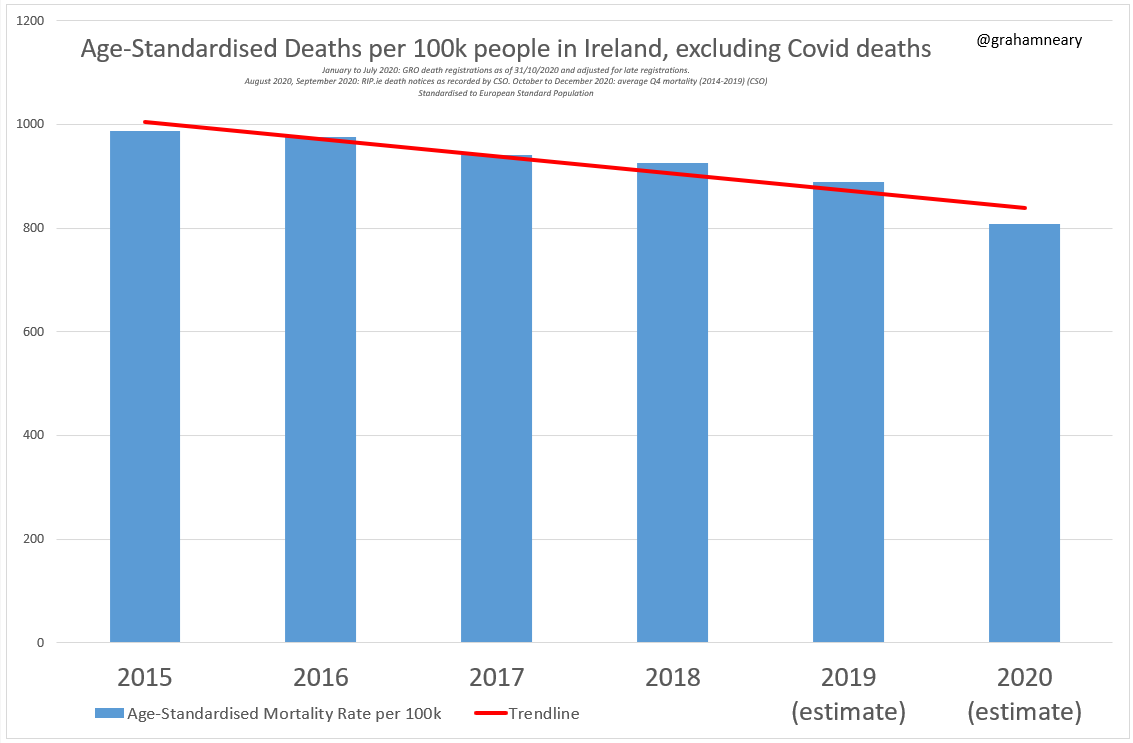
And a perfect continuation of the long-term trend towards lower mortality:
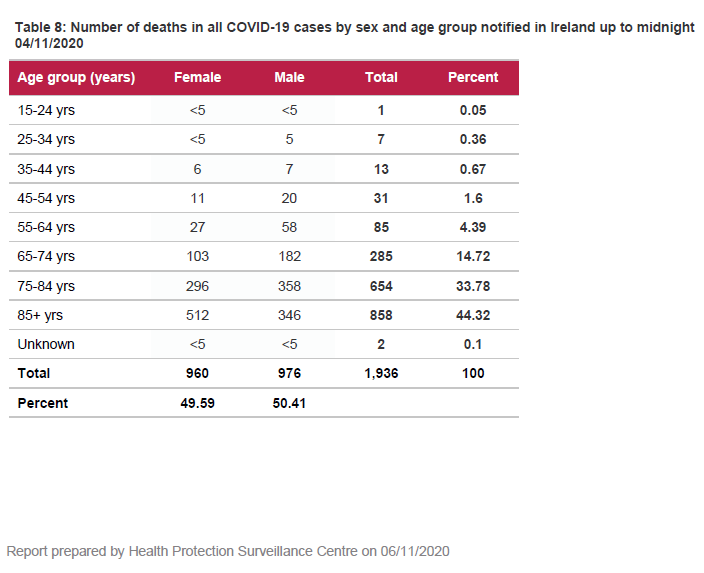
But if I remove all Covid deaths from the analysis, 2020 becomes an outlier year with exceptionally low mortality.

Which do you think is more likely: that 2020 is an outlier year with exceptionally low non-Covid deaths, or that the Covid label has been carelessly applied?
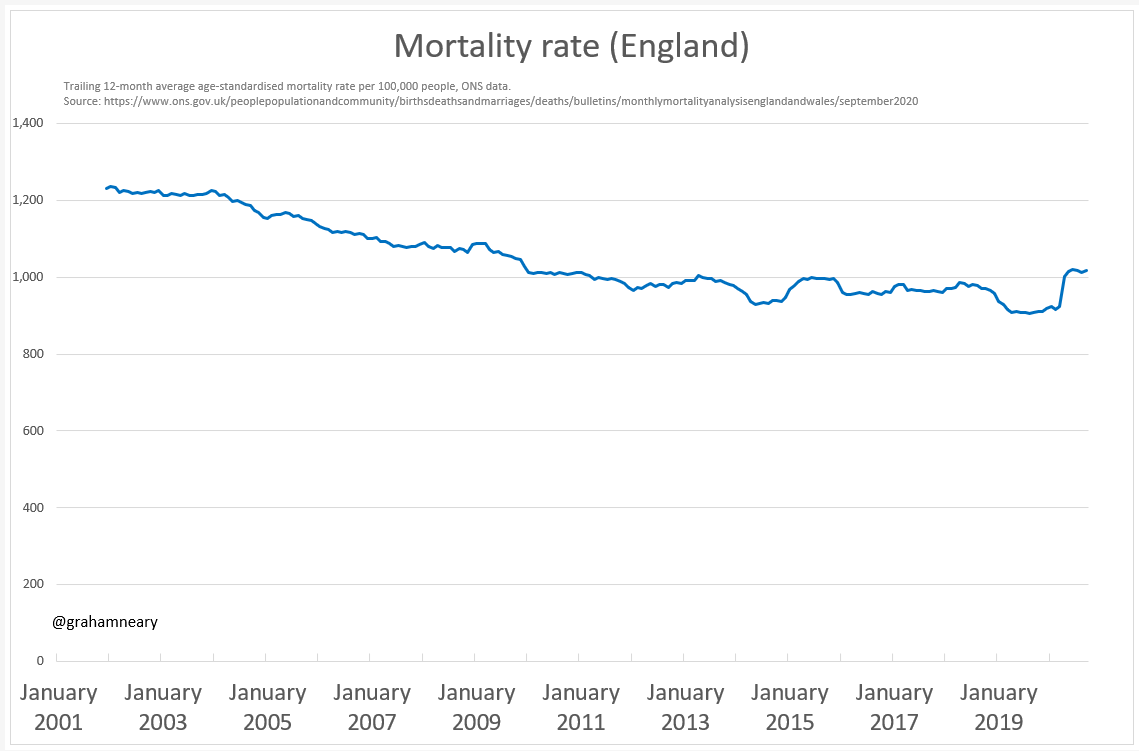
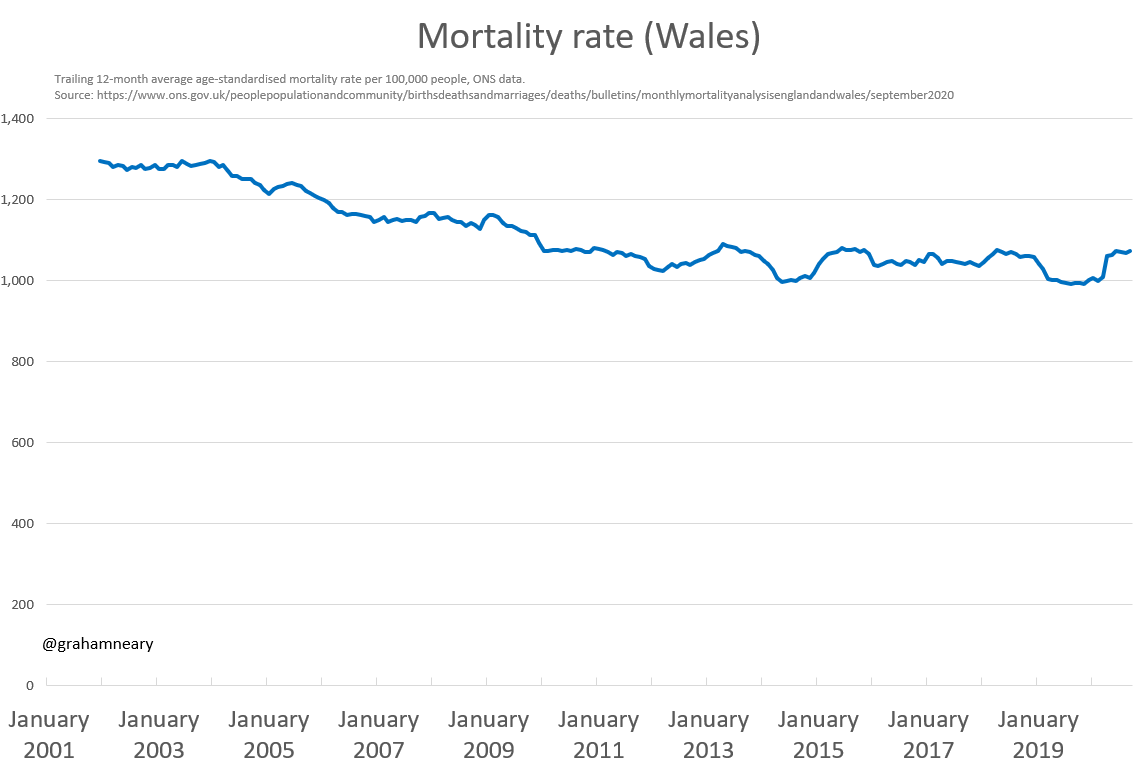
If you can help me find age-adjusted statistics for other countries, please get in touch.

I already know Wales is normal this year. England is 2% worse than 2015.

Sweden has had a normal year, adjusting only for population size.

What if we adjusted Sweden for age, too?πŸ€”

END

β€’ β€’ β€’

Missing some Tweet in this thread? You can try to force a refresh
γ€€

Keep Current with Graham Neary

Graham Neary Profile picture

Stay in touch and get notified when new unrolls are available from this author!

Read all threads

This Thread may be Removed Anytime!

PDF

Twitter may remove this content at anytime! Save it as PDF for later use!

Try unrolling a thread yourself!

how to unroll video
  1. Follow @ThreadReaderApp to mention us!

  2. From a Twitter thread mention us with a keyword "unroll"
@threadreaderapp unroll

Practice here first or read more on our help page!

More from @GrahamNeary

5 Nov
Nobody who understands what I'm about to say can think about the Covid-19 crisis again in the same way. πŸ‘‡πŸ‘‡πŸ‘‡

It's all based on objective data, and simple estimates.

Please retweet this and let's raise the level of understanding.
I've already shown that in Ireland, the first six months of 2020 were nothing special, in terms of deaths per 1,000 people.

The number of deaths was perfectly normal.

Quite surprising!

In that analysis, I adjusted for population growth.

But what about increasing age, which after all is Covid's major risk factor?

The ONS already did this for England: annual age-adjusted mortality is 2% worse than 5 years ago.

Wales is doing slightly better than 5 years ago:
Read 9 tweets
20 Oct
It has been requested that I do a simpler version of this thread, explaining why the modellers advising the Irish government are so amazingly wrong in their forecasts and in their understanding of the risk from Covid-19.

Here goes. πŸ‘‡
1. The death count is wrong. We know this because it has been admitted to be wrong by the government (including by Leo Varadkar) and the number itself makes no sense.

All explained here:

2. The modellers think very few people have been infected so far. Wrong.

They say less than 2% of the population had antibodies 10-14 weeks after the epidemic peak.

But research suggests many people already lose their antibodies 8 weeks after infection.

nature.com/articles/s4159…
Read 8 tweets
19 Oct
Why is Ireland locking down again? Look no further than our Covid-19 spreadsheet modellers.

They are unshakeable in the belief that Covid-19 remains a deadly threat to the population. But as I'm about to reveal, they are standing on shaky ground.

Thread. πŸ‘‡πŸ‘‡πŸ‘‡

#level5 #NPHET
Meet Professor Philip Nolan, Chair of the Epidemiological Modelling Group on Ireland's NPHET. This man is the key provider of Covid-19 statistical analysis and forecasts to the Irish government.

Think of him as the Irish equivalent of Neil Ferguson.

In the thread above, he claims that about 1/3 of all infections were detected by PCR during the epidemic peak in April.

If that's true, and testing continued to find a high % of cases, then total infections so far might only be c. 100k-150k (vs. the official case count of 50k).
Read 13 tweets
18 Oct
We don't have a Covid crisis - we have a public information crisis.

That's my conclusion, after reviewing the latest mortality data from Ireland.

Here are my updated and extended charts.πŸ‘‡πŸ‘‡πŸ‘‡

Please retweet to help get the word out.
Firstly, remember that "Covid-19 deaths" includes people who died of other things.

Leo Varadkar:

"We counted all deaths, in all settings, suspected cases even when no lab test was done, and included people with underlying terminal illnesses who died with Covid but not of it."
Secondly, take a look at the unadjusted all-cause mortality data (with thanks to @Thorgwen).

You'll note that April 2020 (based on deaths registered so far) is comparable to flu months in January 2017 and January 2018.

Year-to-date registrations so far, up to June, look normal.
Read 9 tweets
2 Oct
According to TheJournal, it's a "far-right conspiracy theory" that "Covid-19 death rates are being inflated as a way of justifying continued restrictions on the public."

TheJournal says "Covid-19 was a factor in all of those 1,806 deaths".

Time for a factcheck by Leo Varadkar.
Varadkar:

"In Ireland we counted all deaths, in all settings, suspected cases even when no lab test was done, and included people with underlying terminal illnesses who died with Covid but not of it."

The death count includes people who died with Covid, not of it. Got that?
Varadkar:

"This was right approach but skewed the numbers. Priority is to save lives not look good in league tables."

Is that clear enough? They skewed the numbers to "save lives", by frightening people into accepting restrictions.

Leo is now a right-wing conspiracy theorist.
Read 7 tweets
28 Sep
Today, an RTE article makes a speculative argument that C19 is definitely worse than a bad flu, despite acknowledging fewer death notices from March to May 2020 than "either of the severe flu seasons in December–February in 2017/18 and 2016/17".

rte.ie/brainstorm/202…
Their argument is based on deaths from March to April 2020 being seasonally higher than average.

But then how to take account of Jan and Feb 2020 being lower than average?

Being simple-minded, I simply added up all deaths from January to May.

Result: the 2020 total is normal.
Here's the thread showing how I calculated this:

Read 4 tweets

Did Thread Reader help you today?

Support us! We are indie developers!


This site is made by just two indie developers on a laptop doing marketing, support and development! Read more about the story.

Become a Premium Member ($3/month or $30/year) and get exclusive features!

Become Premium

Too expensive? Make a small donation by buying us coffee ($5) or help with server cost ($10)

Donate via Paypal Become our Patreon

Thank you for your support!

Follow Us on Twitter!