The good news is that the rate in which employed workers are going directly into *permanent* layoff has fallen, though is still elevated [left].

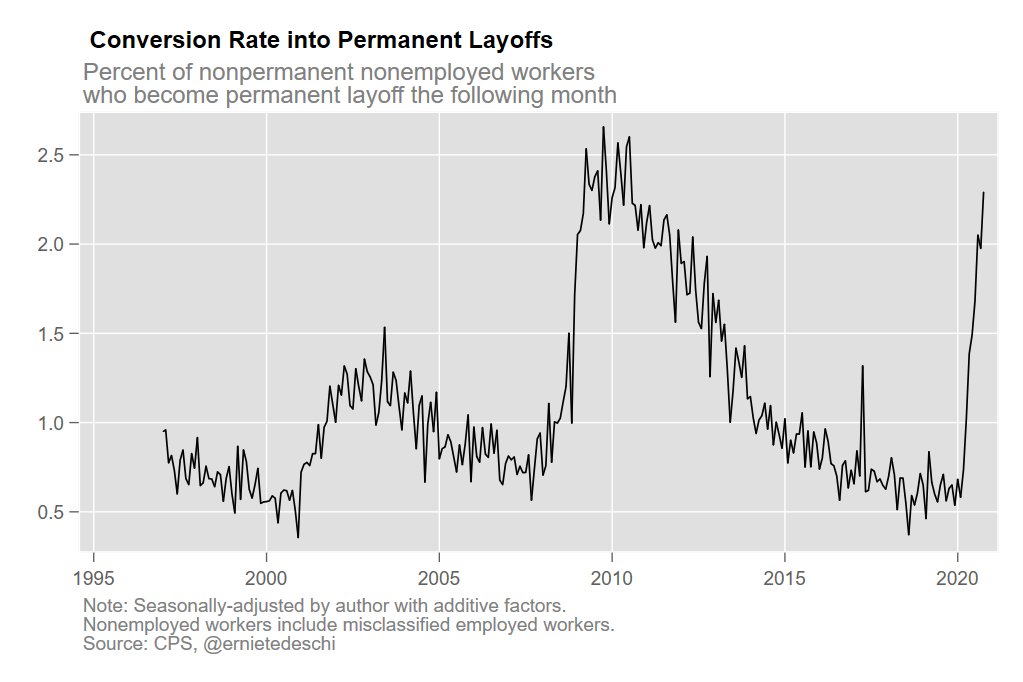
The bad news is that the rate at which already-nonemployed workers are *becoming* permanent layoffs is high and rising [right]. ImageImage
Meanwhile, hourly wage growth among workers keeping their jobs is stable [L], but weekly wage growth has fallen [R], a sign that employed workers are getting fewer hours. ImageImage
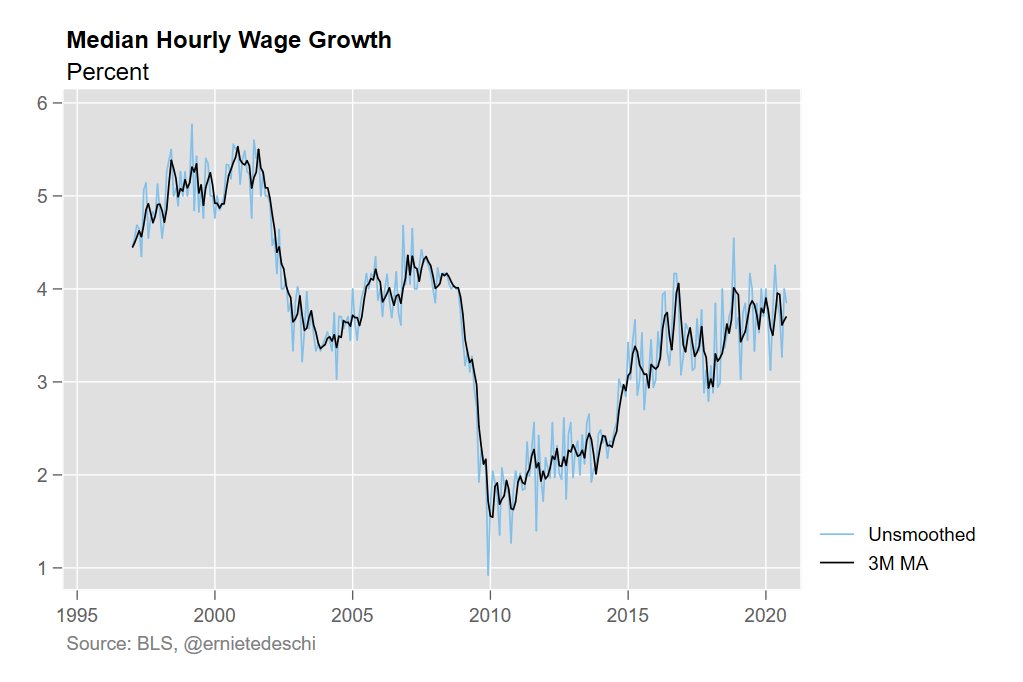
And a rising share of workers aren't seeing any nominal wage growth at all. Image

• • •

Missing some Tweet in this thread? You can try to force a refresh
 

Keep Current with Ernie Tedeschi

Ernie Tedeschi Profile picture

Stay in touch and get notified when new unrolls are available from this author!

Read all threads

This Thread may be Removed Anytime!

PDF

Twitter may remove this content at anytime! Save it as PDF for later use!

Try unrolling a thread yourself!

how to unroll video
  1. Follow @ThreadReaderApp to mention us!

  2. From a Twitter thread mention us with a keyword "unroll"
@threadreaderapp unroll

Practice here first or read more on our help page!

More from @ernietedeschi

12 Nov
The benefit cliff on December 31 is an economic setback when we least need one -- the winter months when businesses in many of the areas of the country will have a harder time staying open -- not to mention devastating for the affected workers.
Unlike the 7/31 expiration of the emergency $600/week FPUC, which was larger in aggregate dollar terms than this cliff, the 12/31 cliff will cut a deeper wound, because for many workers they won't get *any* aid after expiration; they still got base benefits when the FPUC expired.
It's less likely too that prior savings will be there to sustain the spending of unemployed workers; they've been drawing down their savings since the expiration of the $300/week LWA in mid-September. Many workers are likely to have exhausted their pandemic savings by New Year's.
Read 4 tweets
8 Oct
We're past the point where the problem is liquidity -- muni market frictions appear to have subsided, & the Fed has a credit facility aimed at regional governments.

The problem is that state & local revenue bases are collapsing & they legally have to balance their budgets.
The risks we face now actually played out in 2009 & 2010: state & local governments had to make deep cuts (purple bar below in the @BrookingsEcon measure), which became a drag on the then-nascent economic recovery.
If anything, the moral hazard argument around state & local aid cuts the *other* way from how opponents often make it:

The states that did the *right* thing with COVID restrictions likely saw deeper revenue hits, & that may be making them more hesitant to do the right thing now.
Read 5 tweets
6 Oct
@mikemadowitz and I had a productive conversation about this data.

It turns out, the disparity in marriage employment *counts* is mostly an artifact of something else going on in the household survey entirely. /1
Namely, look at what's happened to the number of married men and women reported in the household survey during the pandemic: a rapid rise in February, and then a fall after June. /2 Image
So a great deal of the declines in employment *counts* for married men and women in the household survey is explained by the declines in just the number of married people the survey shows in the first place. /3
Read 15 tweets
2 Oct
Jobs Day, September 2020
Jobs growth came in at +661K in Sept, but the labor market is losing momentum. We're still 10.7 mil jobs short of Feb employment, & 12.1 mil short of our pre-COVID trajectory. At Sept's pace, it will take us 17 mon to get back to Feb emp, & 26 mon to get back to pre-COVID trend.
That 10.7 million job loss since February means that overall employment is still down -7% since then. In the leisure & hospitality industry, it's still down **-23%**.
Read 7 tweets
1 Oct
A short thread on what to expect from tomorrow's jobs report.

TL;DR: two metrics that have done well in predicting employment so far are telling two different stories: one a significant deceleration from August, the other a big acceleration. /1
Two high-frequency employment metrics from private companies--one from Homebase, one from Kronos--have generally followed each other so far this recession.

But in August, the two started diverging significantly. Homebase is on the left, Kronos is on the right. /2 ImageImage
Homebase data has flatlined in recent weeks. Pairing their data with UI claims yields a forecast of +290K jobs in September, not seasonally adjusted.

Kronos meanwhile has accelerated. Using them instead leads to a +2.4 million forecast.

For reference, August was +1.4 million /3 Image
Read 14 tweets
28 Sep
In case you're curious, half of all American tax units paid more than $750 in federal individual income tax in 2019, even after credits. Image
By the way, @TaxPolicyCenter defines a "tax unit" as "an individual, or a married couple, that files a tax return or would file a tax return if their income were high enough, along with all dependents of that individual or married couple." taxpolicycenter.org/resources/tpcs….
Some folks seem surprised that half of American families pay *less than* $750. Some things to bear in mind:

- This chart does not include payroll taxes
- This *does* include tax credits like the EITC & Child Tax Credit
- This includes nonfilers with income too low to pay taxes.
Read 4 tweets

Did Thread Reader help you today?

Support us! We are indie developers!


This site is made by just two indie developers on a laptop doing marketing, support and development! Read more about the story.

Become a Premium Member ($3/month or $30/year) and get exclusive features!

Become Premium

Too expensive? Make a small donation by buying us coffee ($5) or help with server cost ($10)

Donate via Paypal Become our Patreon

Thank you for your support!

Follow Us on Twitter!