Things are obviously horrible re COVID

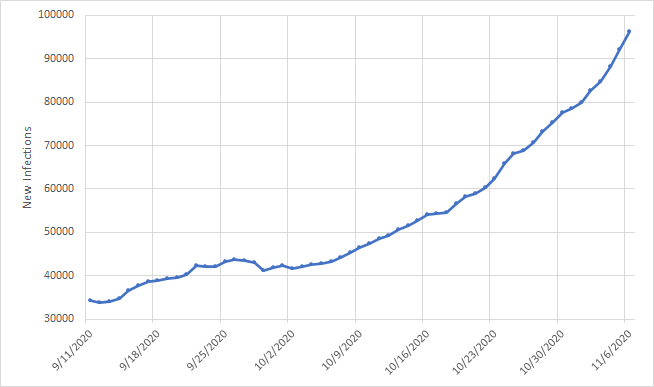
Our 7-day moving avg # of infections now 130K, 11.2% positivity, 60k hospitalizations 1050 deaths

But two of our largest states are still keeping things under control

NY and CA

And if they lose control, things will get much worse

Thread
NY and California combined represent 58 Million People

18% of US population

But they are doing 26% of all tests and rising

Have only 8% of all cases

8% of all hospitalizations

and 6% of all deaths

How are they doing it?
They have similar approaches

On per capita basis, they are, combined, doing about 60% more testing than rest of nation

Both states use data to drive local actions:

When cases rise, they curtail activities locally

Not perfect (hello NYC indoor dining??) but largely works

3/4
Neither NY nor CA immune from national trend of rising infections

And both could be more aggressive

But they are models for how we curtail COVID through the surge

Test a lot

Act early and often

Fine-tune policies based on local conditions

We can all learn from this

Fin

• • •

Missing some Tweet in this thread? You can try to force a refresh
 

Keep Current with Ashish K. Jha

Ashish K. Jha Profile picture

Stay in touch and get notified when new unrolls are available from this author!

Read all threads

This Thread may be Removed Anytime!

PDF

Twitter may remove this content at anytime! Save it as PDF for later use!

Try unrolling a thread yourself!

how to unroll video
  1. Follow @ThreadReaderApp to mention us!

  2. From a Twitter thread mention us with a keyword "unroll"
@threadreaderapp unroll

Practice here first or read more on our help page!

More from @ashishkjha

10 Nov
Biden team won't have formal power to manage COVID until January 20

71 days

Between now and then, we may see additional 100,00 deaths from COVID

Its a horribly high number

Why do I say that? Heres the math

Right now, 1000 people dying every day

That number will rise

Thread
The 1,000 deaths represents infections that happened 4-5 weeks ago

So how many infections happened 4-5 weeks ago?

On October 7, we had about 45,000 cases with 5% positivity rate

Yesterday, we had 110,000 cases with 10% positive rate

These are 7-d moving averages

2/6
So number of identified infections 2.5X

And % positive doubled.....meaning we are missing MANY more cases today than on Oct 7

We're missing so many cases today b/c of our wholly inadequate testing

So I suspect true number of infections at least 3-5X what it was on Oct 7

3/4
Read 6 tweets
8 Nov
Through their votes, the American people have decided they want a new approach to the pandemic

But we have 73 days until new President takes office

73 hard days

Without action, additional 100,000 Americans will die by inauguration day. At least

So we can't wait to act

Thread
The key is that we are not likely to get much action from the Trump Administration

So we need to look for leadership elsewhere

But first, a little data on how we got here

Let’s talk about this moment.

All data from @covid19tracking using 7-d moving avgs

2/n
First, the current surge started soon after labor day.

We went into labor day with about 35K new cases/day

And now, we are at about 100,000 per day New infections in the US from September 11 through November
Read 12 tweets
27 Oct
President keeps saying we have more cases because we are testing more

This is not true

But wait, how do we know?

Doesn't more testing lead to identifying more cases?

Actually, it does

So we look at other data to know if its just about testing or underlying infections

Thread
Easiest is to wait 2-4 weeks

If underlying infections stable but you test more, hospitalizations and deaths will remain stable

But what if you don't want to wait?

Look at test positivity

As testing increases, becomes harder to find the next case

So test positivity drops
Best example is NY, which tests more than 100K people daily, test + of about 1.3%

So now, let's look at where we are as a nation vs 2 weeks ago

All data from @COVID19Tracking using 7d moving avg

Yesterday, did 960K tests
2 weeks ago, 898K tests

So testing is going up

3/n
Read 6 tweets
25 Oct
President Trump, advisor @SWAtlasHoover arguing there's lot of false coding of COVID

This is junk news

Like junk food, junk news tastes good but has no nutritional value

So what are the facts?

Don't hospitals get more $ for COVID?

Thread on hospital billing, COVID, and fraud
Our payment system is insanely complex

So this is a simplification

Hospitals get paid based on what condition patient has

A patient with pneumonia?

Typical hospital might get between $8K to $11K from Medicare, depending on whether pt has major comorbid conditions or not

2/n
So what happened in COVID era?

Cares Act gives hospitals a 20% bump (to about $9600 – 13K) if pneumonia is from COVID

Additional $1600 - $2200 for a typical COVID pneumonia patient

To get this bump, hospitals must document that patient is COVID positive

3/n
Read 11 tweets
25 Oct
I tweeted data from @MWRA_update on amount of virus in wastewater in Massachusetts starting to spike

What about more traditional metrics like infections, hospitalizations and deaths in Massachusetts?

Let's compared today's number with where we were after labor day

Short thread
All data from @COVID19Tracking. 7-day moving avgs

6 weeks ago, Massachusetts had:

323 daily new infections
331 people in hospital
12 people dying every day

Today?

937 daily new infections (up nearly 3 fold)
532 folks in hospital (up 58%)
17 people dying daily (up 37%)

2/3
What's driving this?

Indoor dining recently expanded

House gatherings/parties big driver

Disinformation makes it harder for people to stay focused

And complacency settling in that we did well over summer so we're all good.

We aren't

3/4
Read 4 tweets
21 Oct
On 9/23, Indiana's @GovHolcomb lifted nearly all COVID19 restrictions

wfyi.org/news/articles/…

This struck me and other public health folks as dangerous

A month later, how's it gone?

Pretty badly. Like really badly.

Don't take my word for it.

Let's look at data!

Thread
First, let’s look at Infections over past 2 months

All numbers 7-day moving avg from @COVID19Tracking

Between August 1 and September 23, cases fluctuating between 700-900 per day

Restrictions lifted 9/23

Infections start to take off by Oct 1

By 10/19, over 1800 cases per day
Test positivity was around 9% on 9/23

Today? Around 18%

Meaning Indiana missing way more cases now than they were a month ago

So identified infections AND missed infections way up

Ah you say, but what about hospitalizations?

Isn't that what matters?

3/n
Read 7 tweets

Did Thread Reader help you today?

Support us! We are indie developers!


This site is made by just two indie developers on a laptop doing marketing, support and development! Read more about the story.

Become a Premium Member ($3/month or $30/year) and get exclusive features!

Become Premium

Too expensive? Make a small donation by buying us coffee ($5) or help with server cost ($10)

Donate via Paypal Become our Patreon

Thank you for your support!

Follow Us on Twitter!