Hospitalisations peaked on 4th Nov. Positive tests started decreasing on 2nd Nov.
The test graph shows the 7-day incidence rate. Not sure if that is by result or test date but even if the latter, still far too early for the 30th Oct lockdown to be the cause.
And here is France's estimated R-number, falling steadily from 24th October with no indication that the 30th October lockdown had any effect on the trend at all.
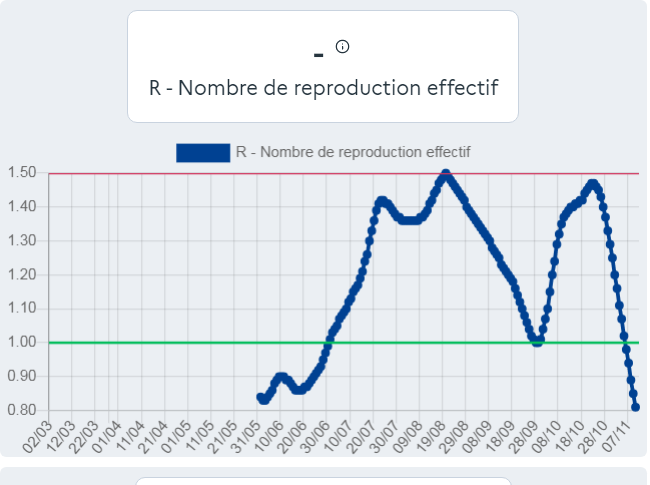
There seems to be a systematic pattern to how the Government presents forecasts/predictions/scenarios to justify more restrictions & lockdowns.
It’s important they are held up to scrutiny after the event.
On 16 Oct, @BorisJohnson justified forcing Tier 3 restrictions onto Greater Manchester because “On recent trends in just over two weeks there will be more Covid patients in intensive care than at the peak of the 1st wave”. mirror.co.uk/news/politics/…
At the peak, NHS report GM Trusts had 171 patients in mechanically ventilated beds (their best measure of ICU numbers).
As of 3 Nov (2.5 weeks after the PM's statement but too early for any Tier 3 effect) MV patients have increased but to 96, still just 56% of the April peak.
Update to English hospital deaths by date. Headline reported figure (225 yesterday, 174 last Weds).
5-day reporting total actually ticks down from 179 to 173 at 30 Oct, though will go up a bit on 31st from reports already in.
Here is the trend in the 5-day reporting total for English hospital deaths. 7-year average now on 155 compared to 645 at the peak.
And here are the regional trends for English hospital deaths using the like-for-like 5-day reporting totals. Still dominated by NW, Mids and NE&Y, though London is also trending up.
Deaths, admissions etc still increasing but relatively slowly (esp. compared to the Govt's presentation on Sat!)
Positive tests down again at 28 Oct, but still not an established trend, e.g. will probably go back up a little on 29th/30th.
7-day average of positive cases down (on 28th Oct) in East, London, NE & NW. Only up in West Mids, other regions steady.
Likely to be some regional variation in subsequent few days.
7-day average of positive tests in hotspots of Liverpool (+ Merseyside), Manchester (+GM), Nottingham, Sheffield, Newcastle all coming down at 28th Oct. Bristol probably down from 29th.
The MRC mid-point forecast (made on 12th Oct) was for 465 deaths / day by 26 Oct & a range of 240-690.
PHE data are now fairly complete for 26 Oct & actual total is 201. A few more will be reported later but final total seems likely to be well below even the lower bound forecast
Forecasting is really difficult & I don’t want to criticise individuals. But it is important that lessons are learnt.
This forecast was made for a date only 2 weeks ahead, i.e. it was based on infections already in the system (given the lag between infections & deaths).
Also, the forecast range was very wide (240 to 690) so it is very striking that data has come in below even the lower bound.
No wonder then that people are sceptical about the modelling the Government presented on Saturday suggesting up to 4,000 deaths per day.
7-day ave positive tests in England actually down 1% on 27th Oct, consistent with increase in Zoe App estimated total infections slowing down.
Deaths & admissions still up but latter just by 1% on 30 Oct.
Notable that 7-day average of positive tests are down (slightly) amongst over-80s in England for first time as of 27 Oct. We will have to see if that trend continues.
In the regions, positive tests down (at 27 Oct) in E Mids (just), East, London, NE & NW. Up in SE, SW & W Mids.
Positive tests also coming down in Scot & NI despite different lockdown approach.